

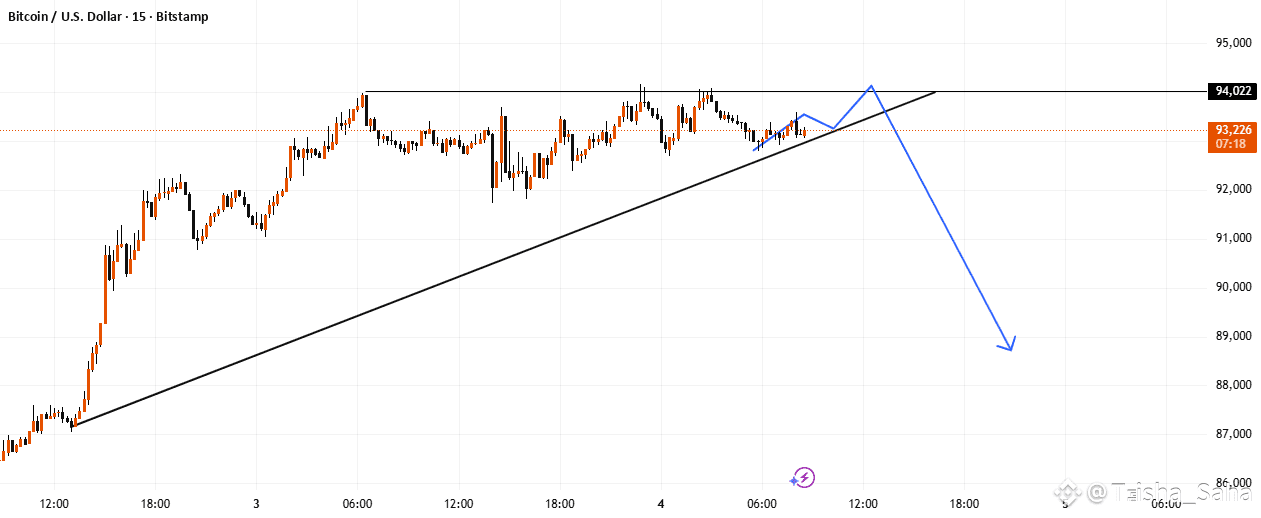
Bitcoin on the 15-minute chart is consolidating beneath a key horizontal level while riding an ascending trendline.
The projection illustrates a possible move where price retests the upper boundary before rotating lower.
This chart is shared only for market observation and educational study.
✅ Analysis (Based on Your Markup)
Price has been respecting an ascending trendline, showing steady short-term support.
The horizontal level near 94,022 is the main area where buyers previously struggled to continue higher.
Your markup shows a potential small bounce from the trendline, followed by another retest of the horizontal zone.
If the market fails to hold after that retest, the blue path illustrates how price could rotate away from structure and expand downward.
The large downward projection shows one possible continuation idea if the trendline and horizontal zone fail to hold.
Overall, the chart reflects a trendline retest + potential break model, depending entirely on how price reacts to the upper boundary.
