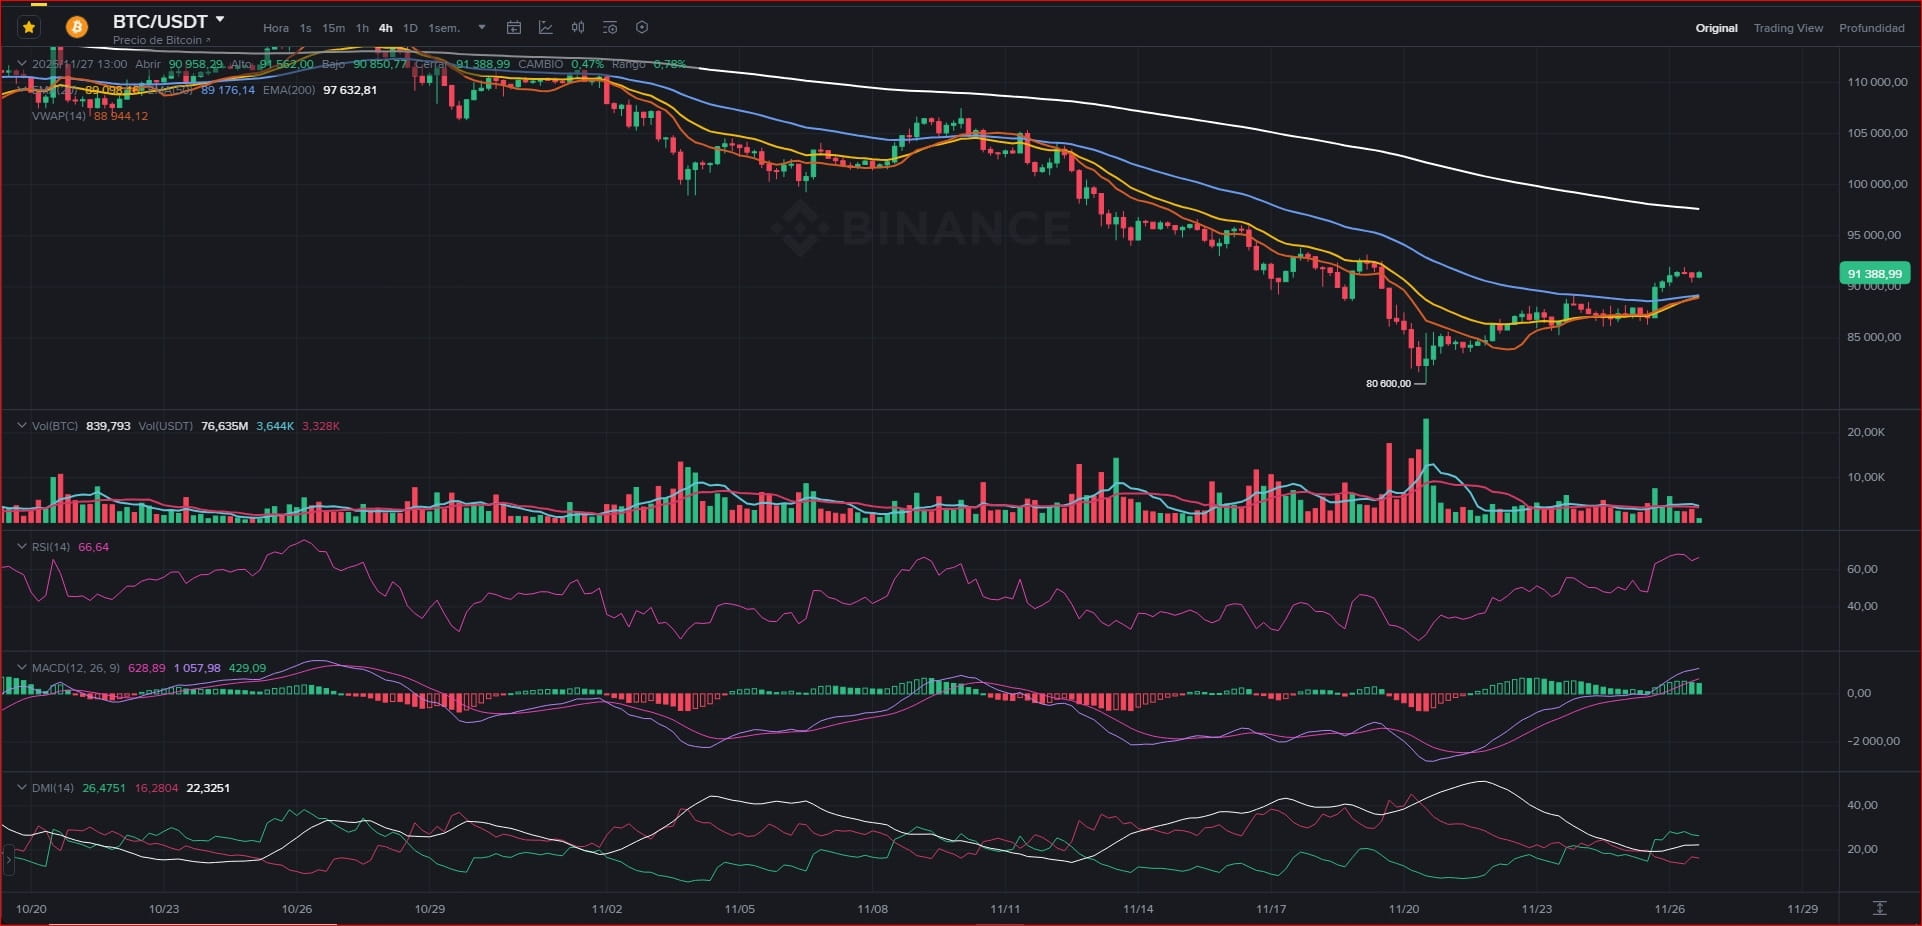
Wall Street is closed for the holiday and $BTC takes the opportunity to rise. The 4-Hour chart shows a flawless technical structure, but... can we trust it?
What the chart tells us:
✅ Break of EMAs: The price ($91,300) has broken strongly above the 20 and 50-period moving averages (Yellow and Blue Lines). Now they are support.
📈 MACD: Bullish crossover confirmed with green histogram.
⚠️ The "Volume" Factor: Since it's a holiday in the U.S., the volume is lower than usual.
My Strategy: Rises on days of low volume are sometimes "liquidity traps"
Bullish Scenario: If we hold $90,500 (EMA 50) as support all day, we could target $95k on Monday.
Caution: Do not over-leverage today. Moves can reverse quickly when real volume returns tomorrow.
🇬🇧 English Summary: BTC is rallying while US markets are closed for Thanksgiving. Technically, it looks great: price reclaimed the 50 EMA (Blue Line) and MACD is bullish. However, be careful with low volume rallies. The key is holding above $90.5k as support. If this level holds, we target $95k next week.
👇 Do you think this rise is real or a trap to catch buyers before the weekend?
#bitcoin #Thanksgiving #tradingStrategy #TechnicalAnalysis #BinanceSquare