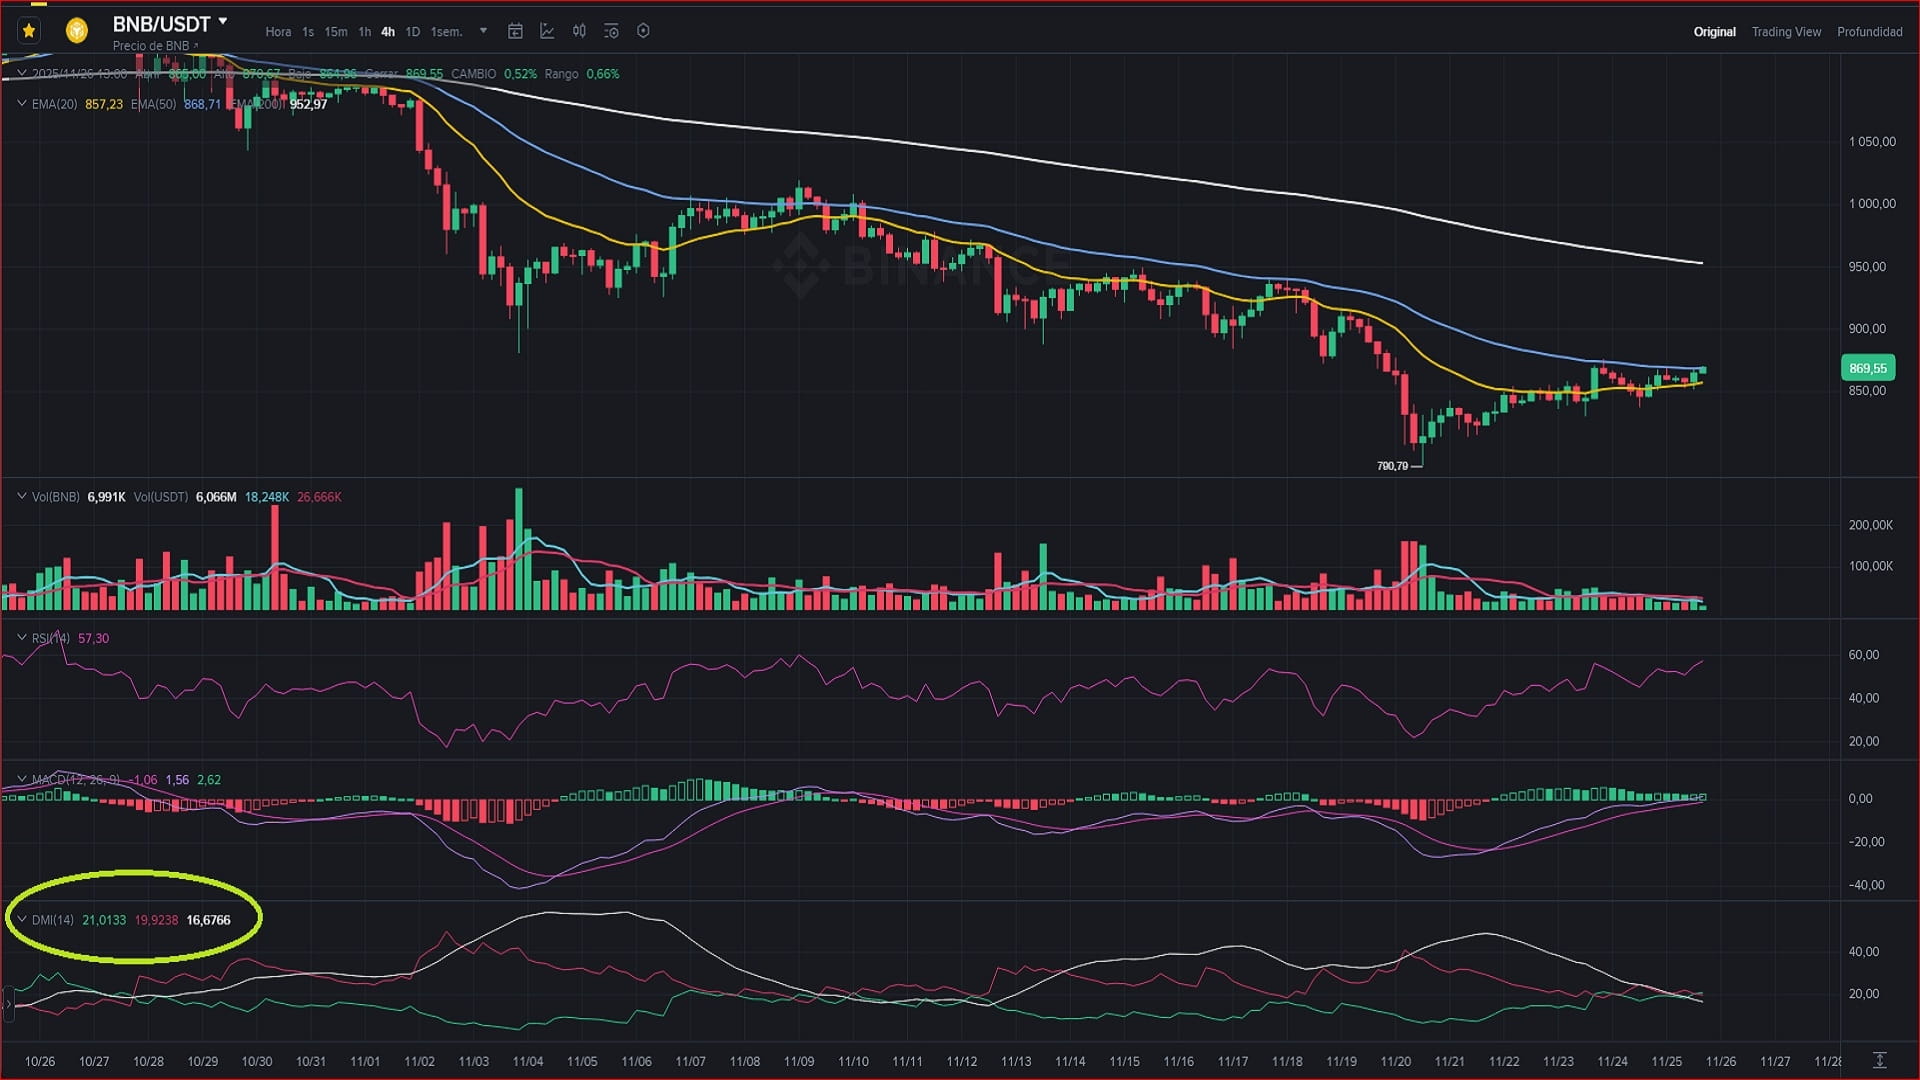
🟡 Analyzing the 4 Hour chart of the house, we see that $BNB ($869) has managed to stabilize after the rebound from $790, but the indicators suggest that we are in a "waiting" phase.
Advanced Technical Reading:
🧱 Support Recovered: The price is holding just above the EMAs 20 and 50 (Yellow and Blue Lines). This is positive.
💤 The ADX Factor: Look at the lower indicator (DMI). The White Line (ADX) has fallen to the zone of 16.
What does it mean? Absence of trend. We are in an accumulation range. When the ADX is this low, it usually indicates the "calm before the storm.
My Projection: The RSI at 57.30 has room to rise. If volume comes in, the price will seek to close the gap towards the 200 EMA (Top White Line) in the $950 zone.
🇬🇧 English Summary: BNB is consolidating above the short-term EMAs (Yellow/Blue) at ~$869. The key signal is the ADX (White Line) dropping to ~16, indicating very low trend strength/volatility. This usually precedes a big move. If bulls step in, the technical target is the 200 EMA around $952.
👇 The ADX is on the floor... Do you think the next strong move will be towards $950 or will we return to $800?
#bnb #BinanceCoin #TechnicalAnalysis #tradingStrategy #BinanceSquare