Bitcoin just hit the death cross
This indicator has predicted every correction since 2018
The last time this happened, BTC dropped by 60% in one month
Here’s what it means why I sold 100% of my BTC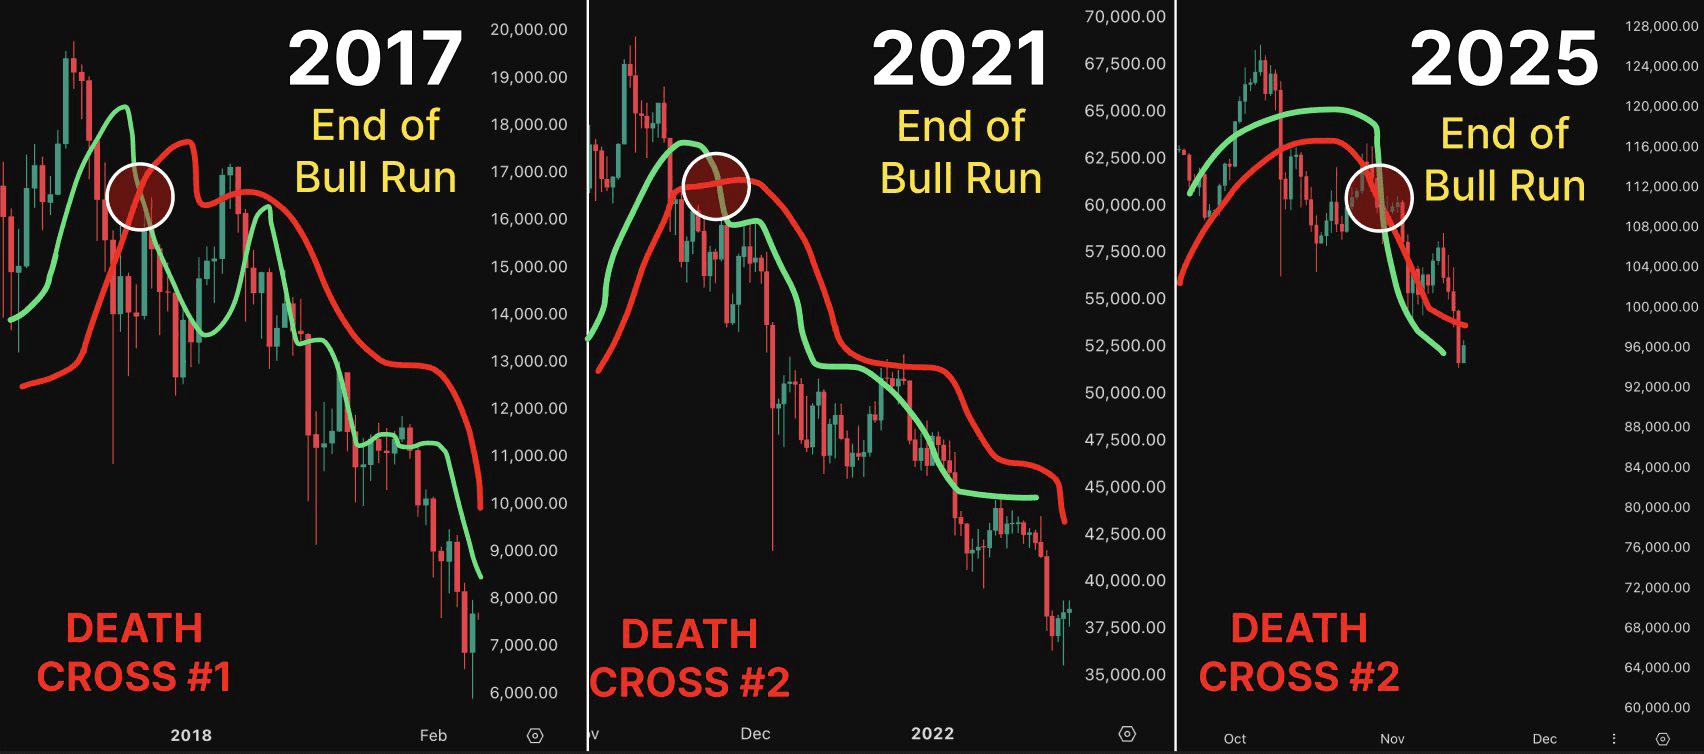
➠ 1
◈ Bitcoin is approaching the death cross, a classic bearish pattern in technical analysis
◈ It forms when the 50-day moving average crosses below the 200-day moving average
◈ This signal indicates weakening momentum in the short term against the long-term trend
◈ BTC has not printed this signal since the last macro peak in 2021
➠ 2
◈ Death cross does not always mean a collapse is guaranteed
◈ In 2015 and 2019, BTC returned shortly after the signal appeared
◈ But in late-cycle stages like 2014, 2018, and 2022, it recorded real peaks
◈ This time, context will determine whether it's false or fatal
➠ 3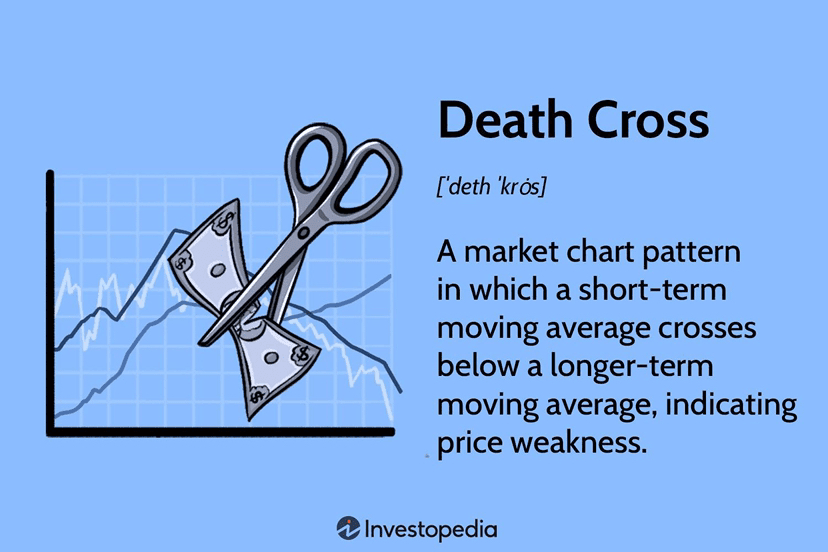
◈ Technically, both moving averages reflect price averages over time
◈ MA 50 shows the last 50 days, faster and more responsive
◈ MA 200 reflects the broader trend, slower and smoother
◈ The crossover indicates that short-term weakness has surpassed long-term strength
➠ 4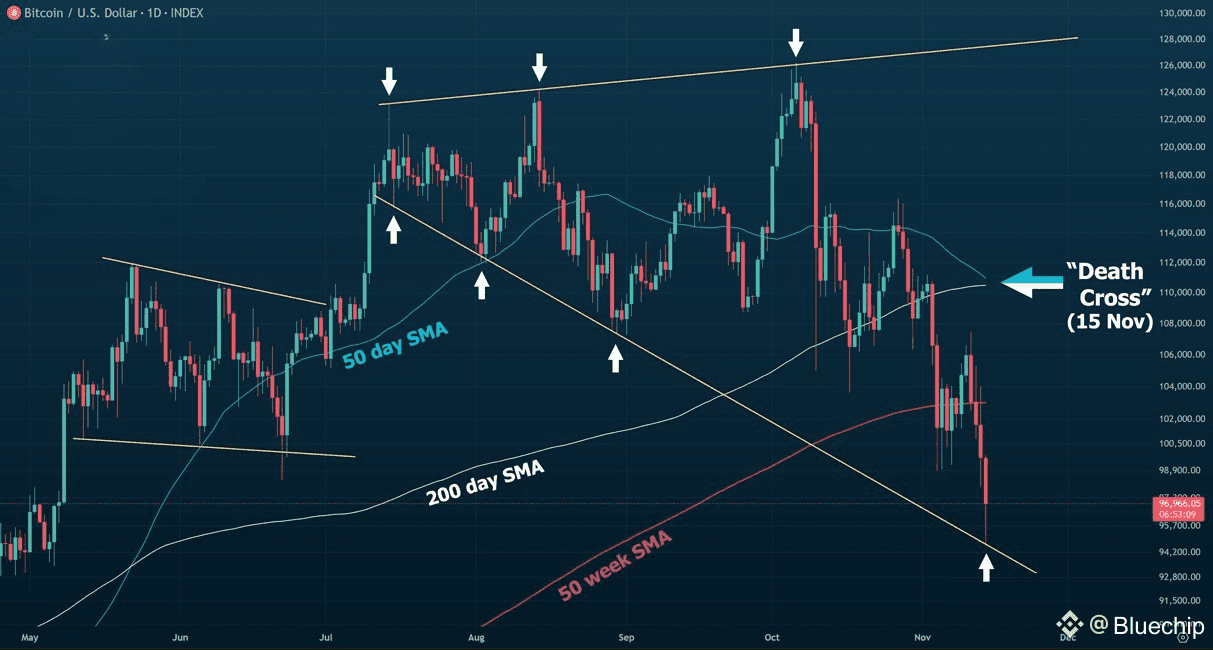
◈ Death cross often develops in 3 phases closely monitored by traders
◈ First, a period of consolidation after a price peak or exhaustion
◈ Second, the actual crossover between MA 50 and MA 200
◈ Third, a collapse where price respects MA 50 as a barrier
➠ 5
◈ Not all death crosses lead to trend reversals; many are traps
◈ The fundamental confirmation comes from other metrics like RSI, MACD, and volume
◈ High selling volume after the crossover confirms a real momentum shift
◈ Weak volume indicates a false breakout or short-term volatility shakeout
➠ 6
◈ RSI divergence is particularly useful during a death cross
◈ If RSI shows overbought conditions near the crossover, a trend reversal is likely
◈ If RSI is already oversold, the drop may be limited
◈ MACD turning negative adds more weight to the bearish outlook
7
◈ Always remember the death cross is a lagging indicator
◈ Reflects a trend that has already significantly weakened
◈ Most price drops occur before the crossover appears on the chart
◈ Use it for confirmation, not for blind entry or panic selling
➠ 8
◈ In strong macro environments, a death cross may indicate a bottom
◈ In risk-averse or late-stage markets, it can indicate extended declines
◈ In 2022, the death cross for BTC led to months of decline and liquidity drain
◈ Context is crucial; macro factors and ETF flows matter more now
➠ 9
◈ Death cross is the opposite of the golden cross; both are signs of a phase
◈ Golden cross MA 50 crosses above MA 200 starts an upward trend
◈ Death cross MA 50 crosses below MA 200 likely to start a downward trend
◈ Both are widely used by funds, algorithms, and individual traders alike
➠ 10
◈ Now, the main test is whether BTC will break out after the crossover
◈ If it reaches a new ATH after the crossover, the four-year cycle may have been broken
◈ If resistance confirms and fades, expect prolonged volatility or decline
◈ In either case, the next few weeks will determine the path towards 2026#StrategyBTCPurchase
#MarketPullback #EUTradeAgreement #WriteToEarnUpgrade CryptoIn401k


