Based on the current $BTC /USDT trading data, I will conduct a comprehensive market analysis from the perspectives of price trends, technical indicators, trading volume, and market sentiment.
Please note that the following analysis is based on current data, the market changes rapidly, and it is recommended to make investment decisions based on real-time information.
1. Price Trend Analysis
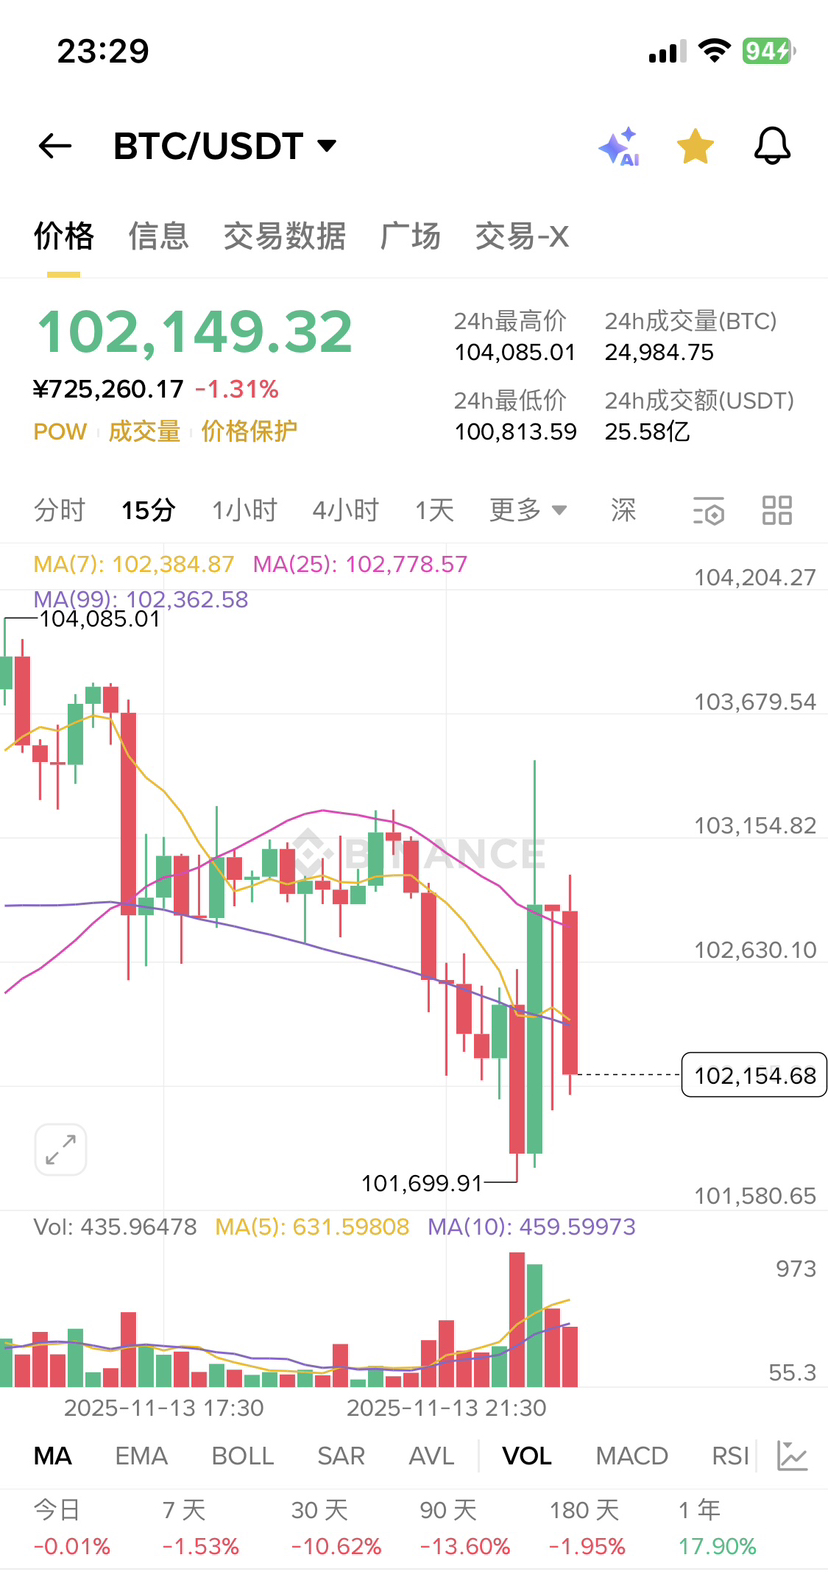
· Current Price: 102,149.32 USDT, 24-hour change rate is -1.31%, showing short-term downward pressure.
· Moving Average (MA):
· MA(7): 102,384.87, the current price is below MA(7), indicating a weak short-term trend.
· MA(25): 102,778.57, the price is significantly below MA(25), confirming short-term bearish momentum.
· MA (99): 102,362.58, the price is slightly above MA (99), suggesting that the long-term trend may still provide support, but caution is needed for the risk of breaking below.
· Key Levels:
· The 24-hour high price of 104,085.01 is a recent resistance level.
· The 24-hour low price of 100,813.59 is a key support level. If it breaks, it may further test the psychological level of 100,000 USDT.
2. Volume Analysis
· 24-hour Trading Volume: 24,984.75 BTC, with a transaction amount of 2.558 billion USDT, indicating high market activity.
· Current Trading Volume: 435.96, below the 5-day average trading volume (631.60), but close to the 10-day average trading volume (459.60). This shows that trading volume is relatively stable, with no significant increase in decline or rise, possibly in a consolidation phase.
· Interpretation: Volume contraction combined with price decline may suggest weakening selling pressure, but if the price rebounds without an increase in volume, there is insufficient upward momentum.
3. Technical Indicator Signals
· MACD: No specific value provided, but from the divergence between price and MA, MACD may be in the negative area, indicating short-term bearish momentum.
· RSI: No specific value provided, but based on price changes (24h -1.31%), RSI may be close to the neutral zone (30-50), not in the oversold state, and there is still room for decline.
· BOLL (Bollinger Bands): No data provided, but the price has fluctuated significantly within 24 hours (range approximately 3,271 USDT), indicating high volatility. If the price approaches the lower Bollinger Band, a rebound may occur.
· Other Indicators: SAR (Stop and Reverse) and EMA (Exponential Moving Average) may also show short-term bearish signals.
4. Time Frame Performance
· Short-Term: Today -0.01%, 7 days -1.53%, 30 days -10.62%, showing weak short-term performance, and adjustments are still ongoing.
· Medium to Long-Term: 90 days -13.60%, 180 days -1.95%, but 1 year +17.90%, indicating that the long-term trend remains positive, and the recent decline may be a correction rather than a trend reversal.
· Interpretation: The market has experienced a correction after a long-term rise; the key is whether it can hold above the 100,000 USDT support level.
5. Market Sentiment and Background
· POW (Proof of Work): Mentioning POW may refer to Bitcoin's mining mechanism, but no further details are provided. Generally, POW-related news may affect market confidence, but current data does not show abnormalities.
· Price Protection: May refer to risk management tools; investors are advised to use stop-loss orders to control risk.
· Overall Sentiment: Due to the price decline and stable trading volume, the market may be in a wait-and-see state, waiting for catalysts (such as macro events or institutional news).
6. Trading Suggestions
· Short-term Strategy: If the price breaks below 100,813.59 support, consider reducing positions or stopping losses; if a rebound breaks through 104,085.01 resistance, a small long position may be attempted.
· Medium to Long-Term Strategy: Long-term investors may focus on the MA (99) support level, gradually building positions on dips, but should control position risk.
· Risk Warning ⚠️: The cryptocurrency market is highly volatile; pay attention to leverage trading risks. Keep an eye on external factors such as Federal Reserve policies and regulatory dynamics.
Lastly, Da Sen summarizes:
BTC/USDT is currently in a short-term downtrend, but the long-term outlook remains positive. Key support level is at 100,813.59 USDT, and resistance level is at 104,085.01 USDT. Trading volume has not increased, indicating that the market may be accumulating energy. It is recommended to closely monitor technical indicator breakthroughs and fundamental news.
If you need deeper analysis or explanations of specific indicators, you can find me in the chat room 💬!