#$SOL
Here’s a detailed look at what’s happening with SOL, why the recent break of its trend matters, and where things could go from here.
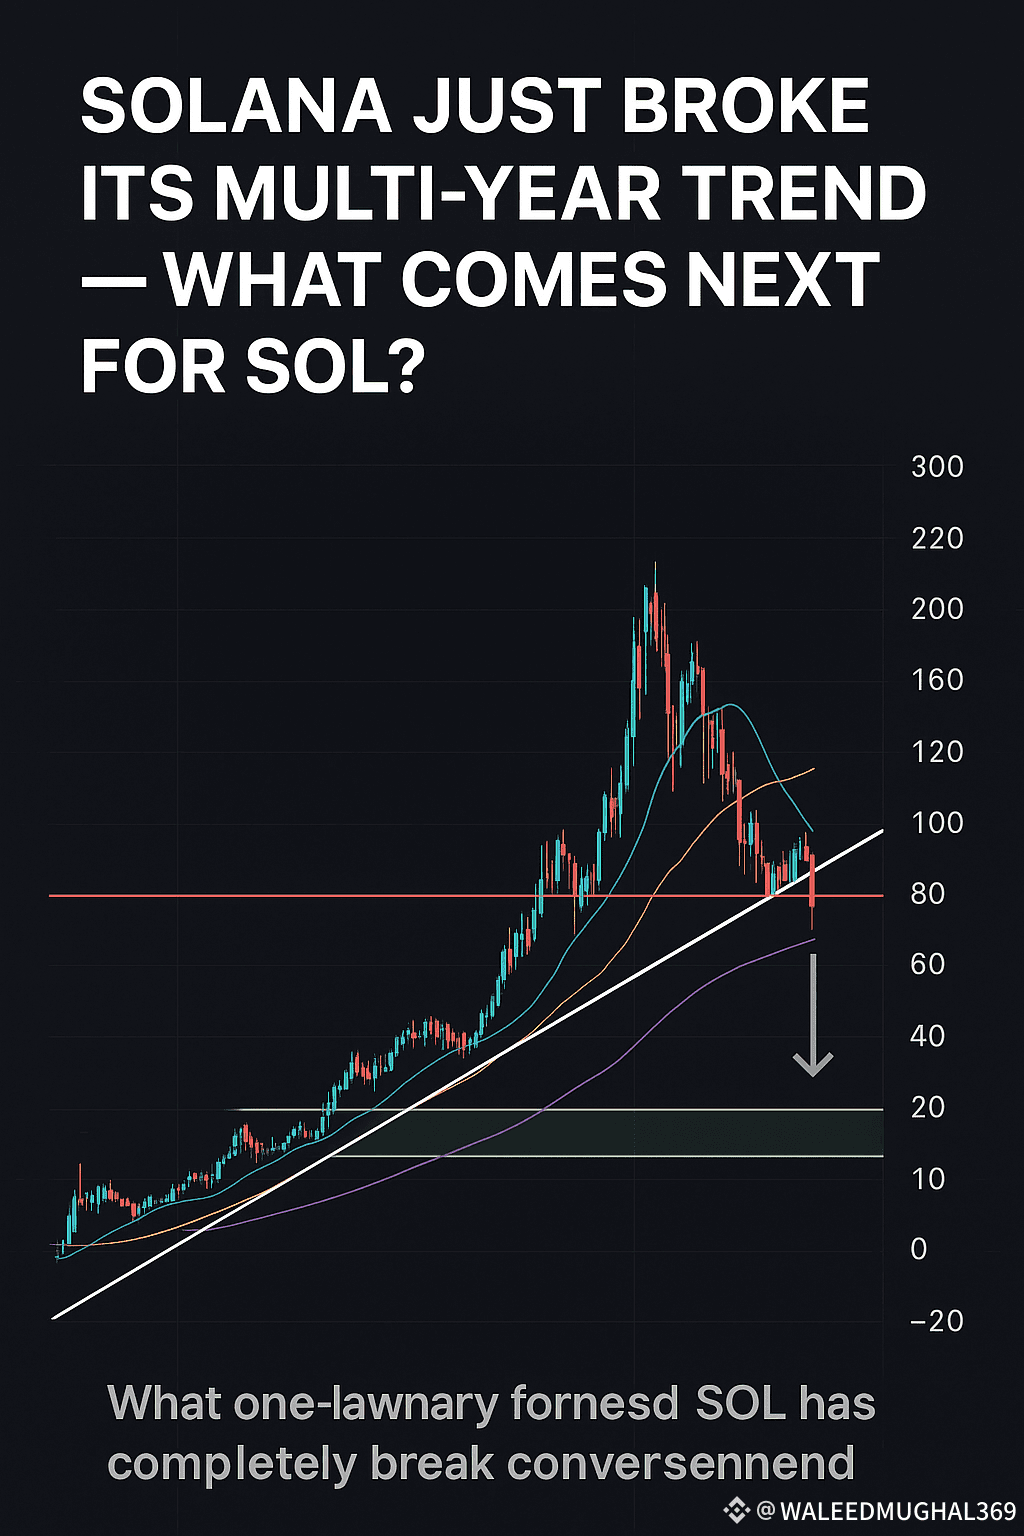
📉 What just happened? Trendline break confirmed
SOL has broken below a multi-year up-trendline that had been touched multiple times, signalling a potential structural shift. Binance+2Traders Union+2
Technical indicators show weakness: SOL is trading below its 20-day, 50-day and even 200-day moving averages, indicating both short- and medium-term bearish pressure. Traders Union
One report describes this as more than a corrective dip—arguing we may be entering a “wave-C” downtrend phase. Binance
$
✅ What still gives bullish hope
Despite the trendline break, other analyses suggest that the long-term bullish structure remains intact for Solana, provided key support holds. TradingView+1
On-chain/network fundamentals remain strong: active addresses, developer activity and ecosystem growth are still positive. CoinCodex
Some patterns in play: e.g., breakout above $220 with institutional accumulation were cited as potential build-blocks for a move higher. Brave New Coin
🎯 Key levels to watch
Support zone: Around $160-$175 is cited as critical. A drop below this may invalidate bullish structure. CoinCodex+1
Resistance / breakout levels: ~$220-$225 first meaningful barrier. A clean breakout above could pave way to ~$300+ or higher. Brave New Coin+1
Medium-term targets: Some analysts project $270-$330 as plausible if breakout holds. Bitget
🔍 Scenario planning: Where could SOL go?
Bearish scenario:
Trendline break leads to loss of support at $175 → drop toward ~$140-$160.
Oversold indicators may drag this lower if sellers dominate.
Base case / consolidation:
Price holds support at ~$160-$175, trades sideways while market digests.
Resistance near ~$220-$225 tested repeatedly.
Bullish scenario:
SOL reclaims and closes above ~$225 with strong volume → triggers breakout.
Momentum carries into ~$300+ zone, maybe beyond to ~$350-$400 if dozens of factors align. Brave New Coin+1
📌 What to keep an eye on
Volume & participation: Breakouts with weak volume tend to fail.
Broader crypto market: SOL often follows trends of larger assets like Bitcoin and overall risk sentiment.
On-chain metrics: Adoption, active addresses, protocol usage can provide early signals.
Technical confirmation: A confirmed close above key resistance (~$225) or a confirmed break below key support (~$160) will help clarify direction.
External macro / regulatory events: Crypto is sensitive to regulation, institutional flows, macro risk.
🧠 My takeaway
While the break of the long-standing trendline is a red flag, it doesn’t mean all is lost for Solana. The long-term bullish case remains alive if key support holds and a breakout above resistance happens. Conversely, if support fails, this could mark the beginning of a deeper correction.
If I were to place a probabilistic view:
40% chance of consolidation / base building
30% chance of breakout to the upside
30% chance of a deeper correction