Welcome. I am pleased to provide you with a technical analysis of the BTTC (BitTorrent [New]) cryptocurrency, focusing on the RSI and MACD indicators and today's forecasts.
Important note: This analysis is based on data available from external sources at the time of request. The cryptocurrency market is highly volatile, and this analysis should not be considered financial advice.
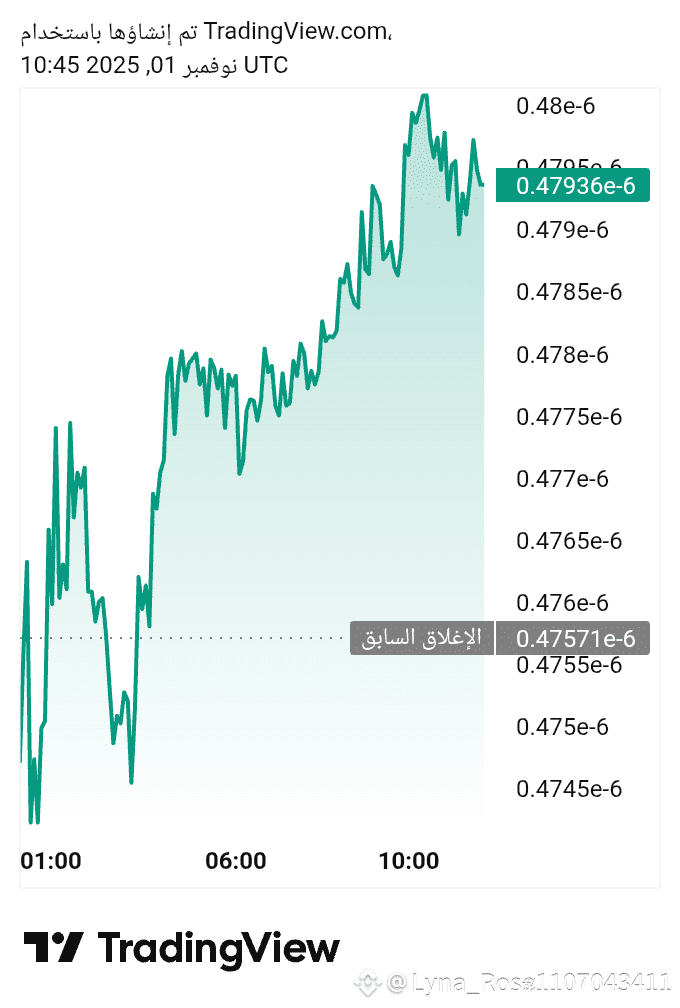
📈 Technical analysis of BTTC (today)
Based on the latest available data from trading platforms (considering that performance is constantly changing):
1. Relative Strength Index (RSI - 14)
Current approximate reading: Recent indicators show that the RSI reading for BTTC tends to be in the neutral zone (between 30 and 70), or it may be closer to the oversold area in some longer timeframes.
Significance:
Neutral reading: It means that the price is still in a state of relative balance, and there is not a very strong momentum for buying or selling at the moment.
If closer to 30 (oversold): this may indicate that the price has recently been oversold, and a short-term bullish rebound opportunity may arise as traders begin to see it as a buying opportunity.
2. Moving Average Convergence Divergence (MACD
Current approximate reading: Some readings suggest that the MACD may be in a negative position (selling trend), where the MACD line is below the signal line, or neutral.
Significance:
Negative MACD: Indicates the continuation of bearish momentum or selling pressure on the currency in the near or medium term, suggesting weakness in the bullish trend.
MACD shows a positive crossover (MACD rising above the signal line): this is currently a rare signal but may indicate an imminent change in momentum towards the upside. This crossover should be closely monitored.
3. Summary of general technical indicators (moving averages and others)
Overall trend: In the short and long term, the general technical summary across most platforms shows a bias towards strong selling, especially when looking at key moving averages (such as MA50 and MA200), where trading is below these levels.
Key support and resistance levels (based on Fibonacci or traditional points):
Nearby resistance level (R1): in the range of $0.00000050 - $0.00000051 (may vary slightly).
Nearby support level (S1): in the range of $0.00000049 - $0.00000049 (may vary slightly).
🔮 Today's forecast (potential scenarios)
As the general indicators lean towards selling or neutrality, and the currency is trading in low price ranges:
Bearish scenario (most likely in the very short term):
Slight selling pressure may continue amid the overall bearish market trend.
The currency will attempt to test the nearby support level ($S1). If broken, it may lead to further declines.
Bullish scenario (technical rebound):
If the RSI reading does indicate oversold (below 35), a technical rebound may occur with the entry of some new buyers.
To achieve a sustainable rise, the price must break through the nearby resistance level ($R1) and show a clear positive crossover in the MACD, supported by an increase in trading volume.
Neutral scenario (fluctuation):
The currency may continue to fluctuate within a narrow range between the mentioned support and resistance levels, waiting for a catalyst or a change in the overall market movement of cryptocurrencies (like Bitcoin's performance).
$BTC BTTC
BTTC
0.00000049
+4.25%
⚠️ Disclaimer:
Please note that the technical analysis of BTTC currently shows a bias toward neutral to selling on daily and longer timeframes. Any rise may be a technical rebound unless confirmed by breaking significant resistance levels and a noticeable increase in momentum (positive MACD and high trading volume).

