

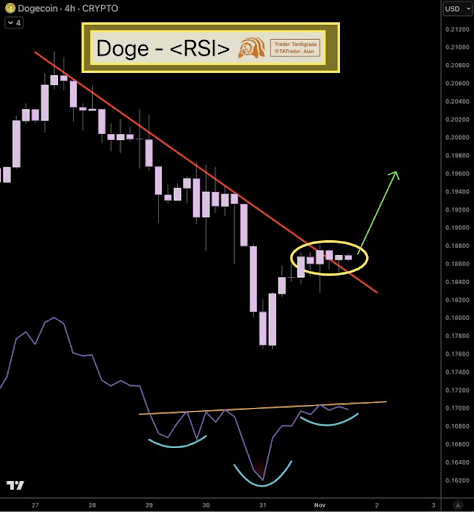
Dogecoin forms an inverse head and shoulders on RSI, aligning with a price breakout above descending resistance.
DOGE consolidates above $0.185 after a breakout, signaling possible accumulation before a move toward $0.200.
Derivatives data show strong bullish bias with rising long positions and minimal liquidation activity.
Dogecoin’s price is displaying early signs of recovery as a breakout above its resistance trendline coincides with a bullish inverse head and shoulders pattern on the RSI, suggesting improving market sentiment and potential short-term upside momentum.
Breakout Above Resistance Signals a Structural Shift
The chart shared by Trader Tardigrade (@TATrader_Alan) presents a notable shift in Dogecoin’s short-term structure. DOGE has successfully broken above a descending resistance trendline, a technical move that often signals a reduction in selling pressure. This development reflects an improvement in buyer participation following several sessions of lower highs and lower lows.
Source: TATrader_Alan via X
Following the breakout, Dogecoin's price went into a tight consolidation range between $0.185 and $0.188. This sort of price behavior often indicates that buyers are building their positions just above the old resistance-a common pattern in early bullish reversals. Stability in this area strengthens the feeling that the market is preparing to continue higher toward higher resistance zones.
At the time of writing, Dogecoin changes hands at approximately $0.187, up 0.85% on the day. In terms of price structure, there is no constructive consolidation above the breakout level, with key short-term support in case of a re-test at $0.182. Any continued price action above $0.190 would argue for trend reversal and expose targets at $0.200 and $0.210 respectively.
RSI Formation Strengthens Bullish Outlook
Parallel to the price breakout, the RSI indicator has formed an inverse head and shoulders pattern — a classic signal of momentum reversal. This setup, marked by three troughs with the central one deeper, points to a transition from bearish to bullish control. The neckline drawn across the RSI has been tested multiple times, suggesting rising pressure from buyers attempting to push momentum higher.
When RSI patterns align with structural price shifts, traders often consider the confluence a strong validation of emerging momentum. In this case, the RSI’s gradual ascent above its neckline could serve as confirmation of strengthening internal dynamics supporting Dogecoin’s rebound.
This dual confirmation — from both price and momentum — establishes a foundation for short-term bullish bias. A decisive candle close above $0.190, accompanied by increasing volume, would further affirm the trend’s durability and invite momentum traders back into the market.
Derivatives Data Indicates Growing Confidence
Beyond the spotThe Binance long-to-short ratio now reads 2.6456, which suggests that longs far outweigh the amount of short exposure. For top traders, the ratio jumps to 3.0128, which suggests there's much firmer confidence from higher-volume participants in continued recovery.
The long/short ratio on OKX is at 3.5, which reinforces the perception that speculative traders are seeking upside potential. The consistency of these readings across major exchanges points to coordinated optimism within the derivatives segment.
Meanwhile, liquidation activity remains subdued, with just $385 cleared in one-hour and $16.91K in four-hour intervals. This is because the calm environment provides less leverage-induced volatility, allowing natural formation without having to deal with too unsettling price fluctuations. In all, this leads to the fact that Dogecoin's recent surge is growing steadily, bolstered actually by demand and not excessive speculation.
The post Dogecoin Breaks Resistance as RSI Inverse Head and Shoulders Signals Momentum Reversal appears on Crypto Front News. Visit our website to read more interesting articles about cryptocurrency, blockchain technology, and digital assets.
