
Bitcoin has officially closed October 2025 at –3.67%, and while the drop may look small, history suggests this kind of red October is not something to ignore. The last time BTC printed a similar pattern was October 2018, and what followed was brutal:
November 2018: –36.57%
December 2018: –5.15%
✅ That was the capitulation phase of the cycle.
Now traders are asking: Is 2025 about to repeat 2018?
Is the bull market already over — or is this just the shakeout before the next leg up?
Current Price Action
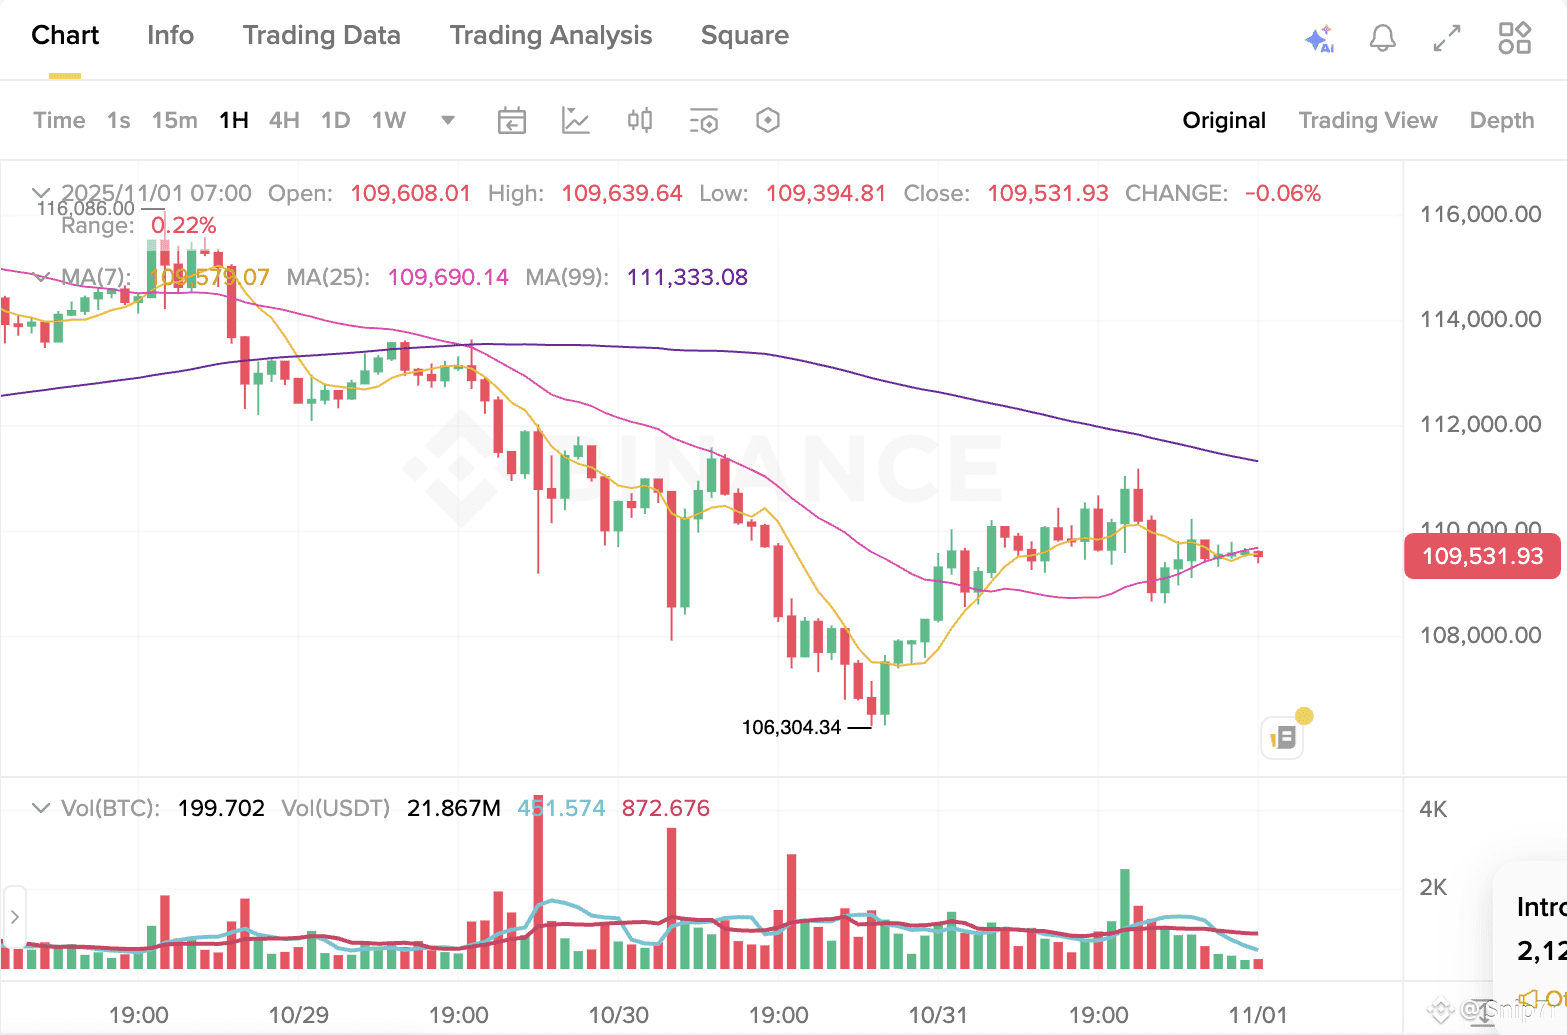
Price now (BTC/USDT): ~$109,531
24h High: $111,190
24h Low: $108,435
Volume: 21,251 BTC
On the 1H chart: Price sits below the MA(99) near $111,333, which has been acting as dynamic resistance.
BTC recently touched $106,304 before bouncing, but the recovery has been weak. The market is waiting for a breakout above resistance or a breakdown below support.
📌 The Historical Pattern: The 2018 Warning
In 2018, Bitcoin finished October slightly red — just like now.
Traders didn’t worry… then November arrived.
Support levels snapped one by one
Volume spiked
Price sold off nearly –40%
Small red in October turned into full-scale capitulation.
So the warning is real: A negative October has historically been a signal of high volatility ahead.
✅ But 2025 Is Not 2018
There’s another side to this story.
In 2020, Bitcoin also had volatility heading into Q4 — yet November printed:
+42.95% in November
+46.92% in December
So historically, November is not guaranteed bearish. After halving cycles, it is often explosively bullish.
This is why traders should avoid assuming the top is in.
📈 Key Levels to Watch
Bullish Breakout
Reclaim $111,500–$112,000 on strong volume
Break MA(99) resistance
Potential upside targets: $114K → $116K → $120K+
If buyers step back in and BTC stays above $111.5K, the bull market remains fully alive, and November could mirror the 2020 rally.
Bearish Breakdown
Lose $108,000, then $106,300
Selling pressure accelerates
Next liquidity zones around $103K–$101K
If these levels fail, the market could repeat a 2018-style flush before forming a bottom.
📌 So… Should Traders Be Worried?
Caution? Yes. Panic? No.
The –3.67% close in October is a factual warning sign.
The current price at $109.5K shows hesitation and weak volume.
But Bitcoin bull cycles often survive sharp corrections before rallying again.
Right now, the market is at a decision point:
✅ Hold and reclaim key resistance → bull trend continues
❌ Breakdown and lose support → deeper correction likely
🧭 The Outlook for November
November has never been a boring month for Bitcoin.
We either see:
The big shakeout (2018-style)
orThe big green comeback (2020-style)
With volatility rising, traders should prepare for both outcomes, not freeze.
✅ Bottom Line
October’s red close is a warning, not a confirmation of a bear market.
BTC must break back above $111.5K to remain safely bullish.
Losing $106K opens the door to a deeper pullback.
The bull market is not dead — but November will decide its direction.
Stay alert, trade level-to-level, and remember:
Bitcoin never ends the year quietly.
