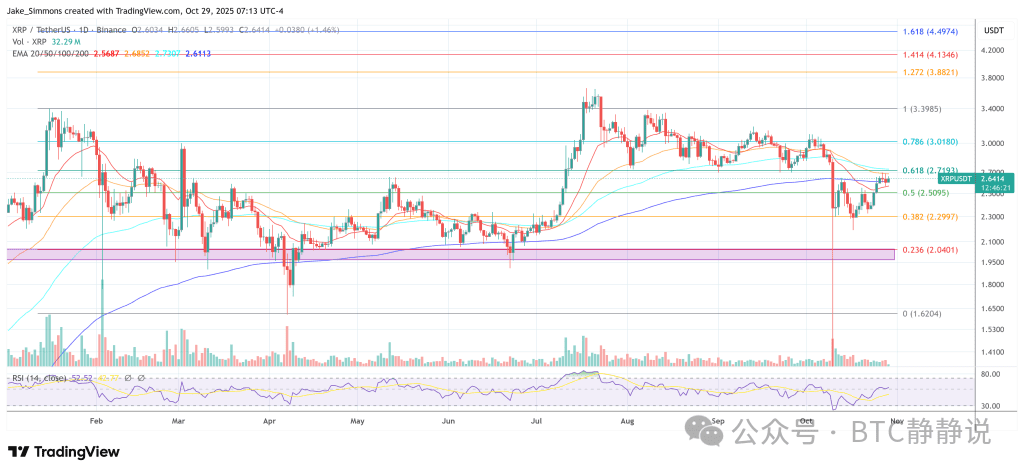
Cryptocurrency analyst Ali Martinez warns that after the TD Sequential indicator issued a new sell signal on the daily chart, XRP may be facing a new round of declines. In a newly released video and transcript, Martinez shared a TradingView chart of the Binance XRP/USDT perpetual contract and stated, "XRP may be about to face a correction. Over the past three months, the TD Sequential indicator has been very accurate in predicting trend reversals for XRP on the daily chart, and it has just issued a new sell signal."
Is XRP about to see a drop of over 16%?
Martinez cited a recent series of TD indicator data as support, which he believes aligns with significant reversal points. "On July 22, the sell signal led to a 24% pullback. On August 8, the sell signal led to a 17% pullback. On August 23, the sell signal caused a 13% decline. On September 15, another sell signal triggered a 13% drop. On September 27, the buy signal led to a 12% rebound. On October 22, the buy signal caused a 14% rise. Now, the TD sequence indicator has just issued a sell signal, indicating that a pullback may be in progress."
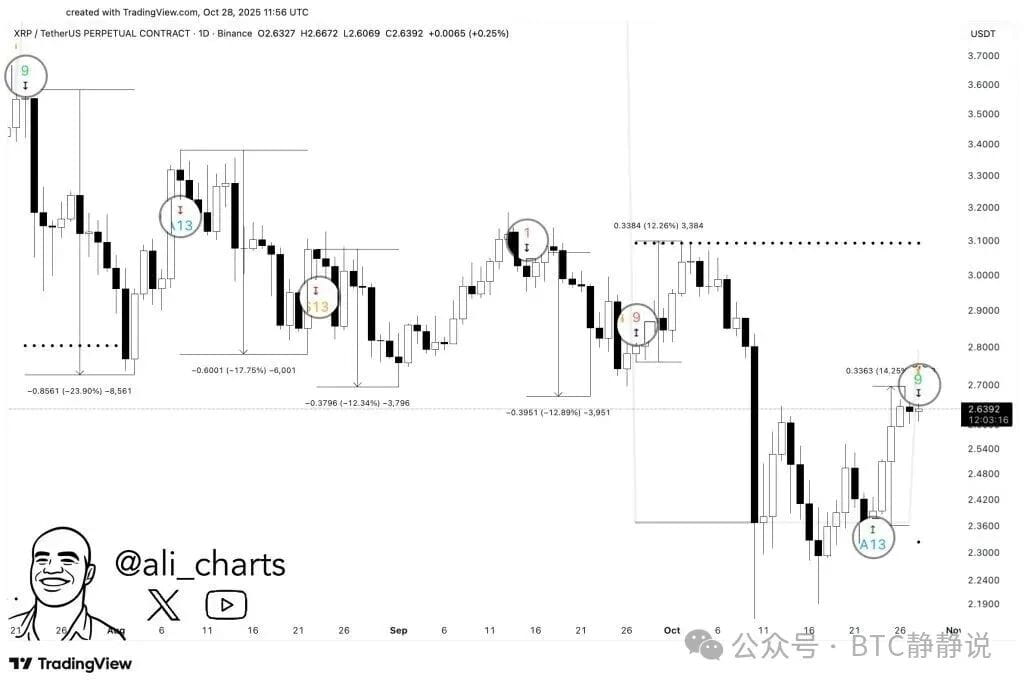
The above chart shows the daily chart of the Binance XRP/USDT perpetual contract, with TD marked points. It shows pullbacks and rebounds close to the magnitudes listed by Martinez, with boxes highlighting the declines of approximately -23.9%, -17.75%, -12.34%, and -12.89% after previous sell signals, and rebounds of about +12.26% and +14.25% following buy signals in late September and late October.
The latest candlestick near the $2.64 mark on the chart is marked with a new '9' sell signal, confirming the analyst's warning that if this pattern continues, the next wave could tilt downward.
The TD sequence signals are timing tools, not directional guarantees, and their effectiveness is usually judged retrospectively by the stability they exhibit near exhaustion points. Martinez's argument is based on experience and is narrowly focused, limited to the recent three-month sample displayed in his charts, where the recorded signals have significant correlations with local peaks and troughs.
Therefore, the current situation depends on whether XRP will follow the latest selling trend as it did in July, August, and mid-September, or if the market will break this rhythm as occasionally occurs in trending environments.
Martinez did not predict price targets or durations beyond those historical similar situations he listed; his only clear inference is that, given the recent performance of the TD signal on the daily chart, another round of pullback is statistically reasonable. Based on the recent four TD sell signals (-24%, -17%, -13%, -13%), the average retracement is about 16.75%, which, if this pattern repeats, suggests that prices could fall to around $2.20.
As of the time of publication, XRP is trading at $2.64.