BTCUSD
Structure | Direction | Key Reaction Areas
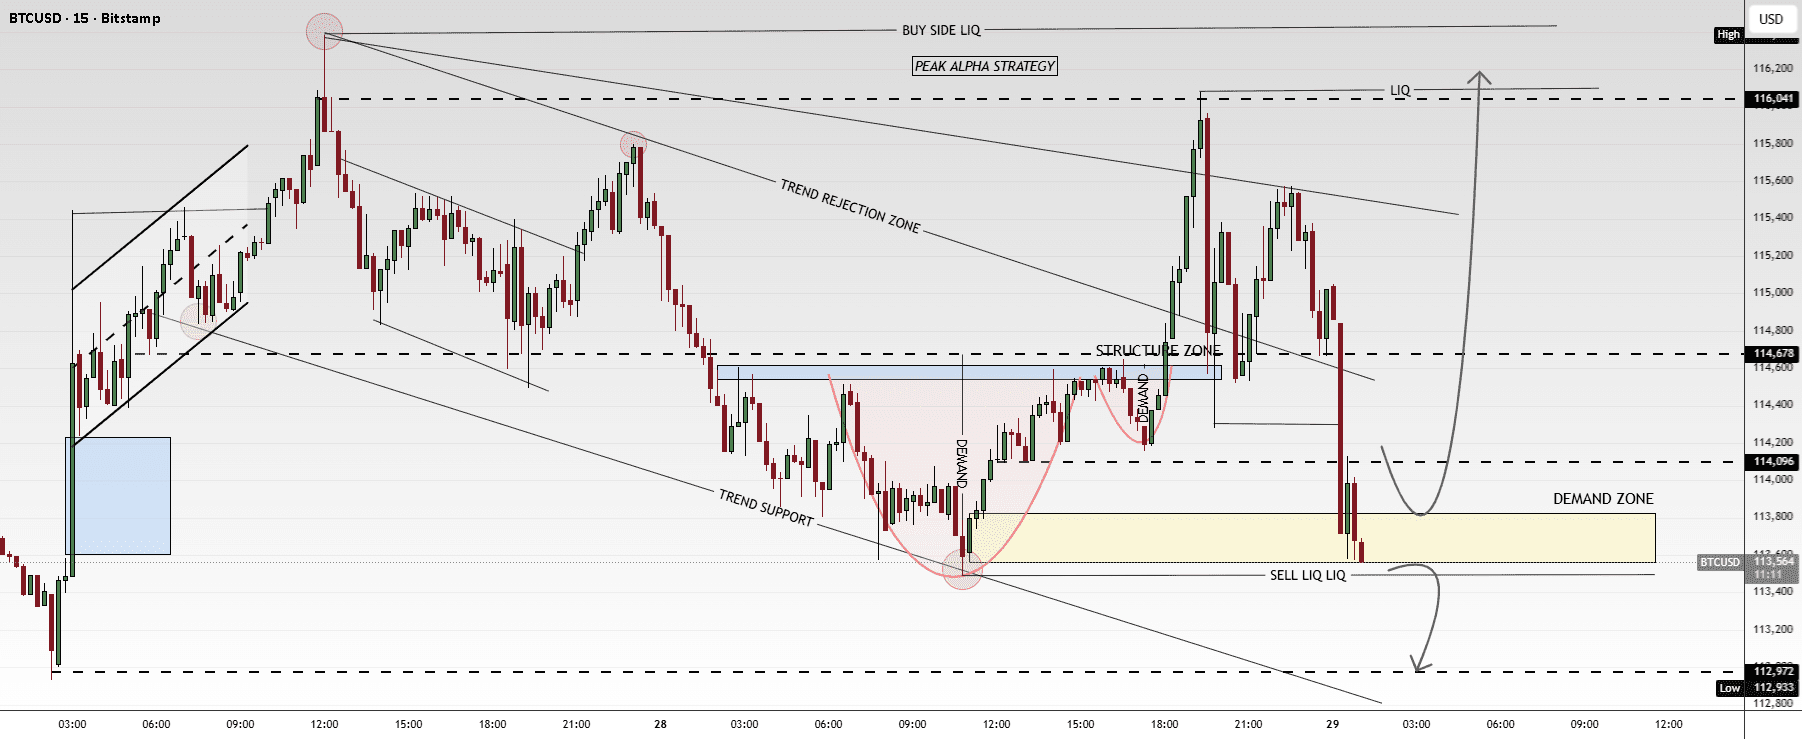
BTC continues to respect the downward channel structure, facing consistent rejection from the directional rejection area while maintaining a clean liquidity behavior at the bottom. Prices have touched the demand area (113,600–114,000) after a strong liquidity pull from the selling side, setting up a potential rebound phase.
Market Overview
After pulling liquidity below 113,700, prices reacted strongly from the demand zone, indicating buyer activity and the potential for a short-term upward correction.
A clean correction above 114,100–114,400 may lead to a new test towards 114,700–115,000, in line with the previous structural area.
However, a breakdown below 113,600 would invalidate the bullish setup, revealing deeper liquidity towards 112,970–112,930.
Main scenarios
✅ Bullish scenario 🚀 → above 114,100
🎯 Target 1: 114,700
🎯 Target 2: 115,200
🎯 Target 3: 116,000
❌ Bearish scenario 📉 → below 113,600
🎯 Target 1: 113,000
🎯 Target 2: 112,930
Current levels to watch
Resistance 🔴: 114,400 – 114,700
Support 🟢: 113,600 – 113,000
⚠️ Disclaimer: This analysis is for educational purposes only. Not financial advice.
#WriteToEarnUpgrade #AltcoinETFsLaunch #US-EUTradeAgreement #CPIWatch #bitcoin