

BNB is facing a critical turning point. The token has just confirmed a bearish double-top pattern, suggesting potential further downside — even as it gains major visibility following new listings on Robinhood and Coinbase.
According to TradingView data, BNB has fallen 8% in the past seven days and is now 20% below its all-time high of $1,369.99, reached on October 13.
At the time of writing, BNB trades at $1,087, up nearly 2% following the exchange listings.
BNB Gains Exposure to U.S. Retail Investors
On October 22, Robinhood officially listed BNB, opening the token to millions of retail investors across the United States. Just a day later, Coinbase, the country’s largest crypto exchange, followed suit — boosting both visibility and perceived legitimacy of the Binance ecosystem.
Listings on top-tier exchanges like these often act as a catalyst for bullish sentiment, increasing liquidity, community engagement, and institutional attention.
Meanwhile, the prediction market Polymarket recently expanded to the BNB Chain, offering users lower costs and faster transactions — a move expected to enhance liquidity and strengthen the broader DeFi ecosystem built on BNB.
Double-Top Pattern Confirmed — What’s Next for BNB?
From a technical standpoint, BNB has confirmed a textbook double-top formation, one of the strongest bearish reversal signals.
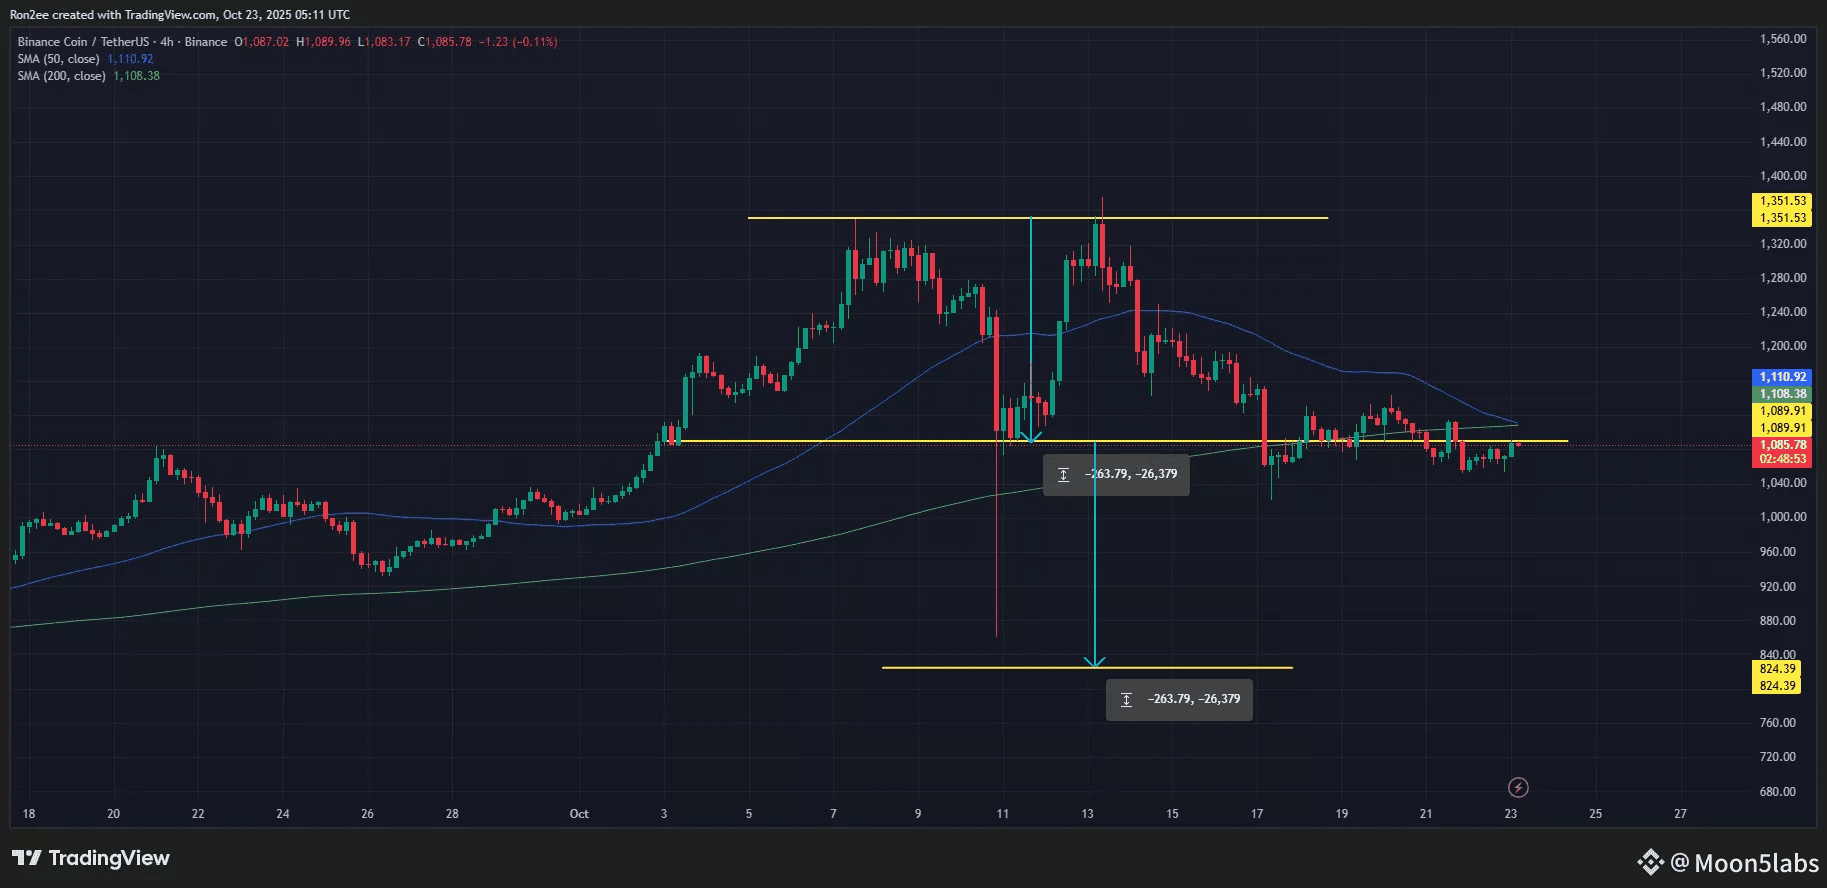
The two peaks formed around $1,351, both showing strong rejection wicks — a classic sign of buyer exhaustion. The neckline sits at $1,087, the current trading level, leaving BNB vulnerable to volatility.
Moving averages add to the pressure: the 50-day SMA is approaching the 200-day SMA, indicating a potential “death cross” — a pattern that historically precedes longer downtrends.
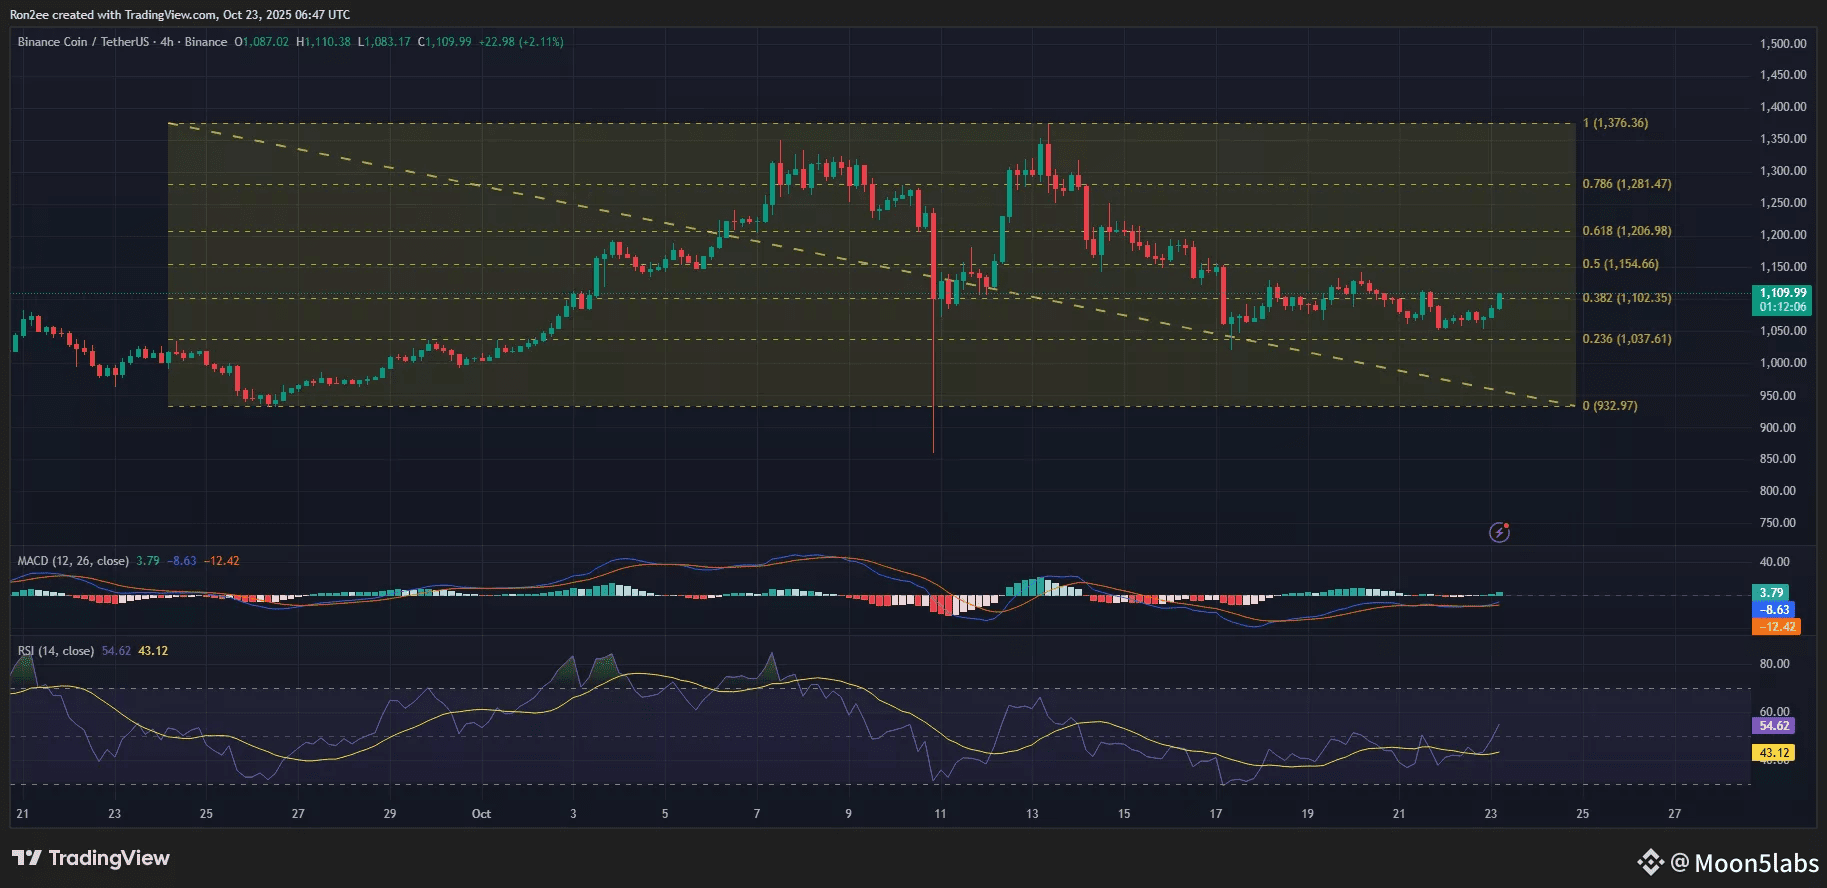
However, some momentum indicators hint at hope.
The MACD line has crossed above the signal line, suggesting short-term buying strength, while the RSI has climbed above 50, hinting at a possible rebound attempt.
Key Levels to Watch
🔹 Support: $1,037 (23.6% Fibonacci retracement)
🔹 Resistance: $1,111 (50-day SMA) and $1,150 (psychological level)
A drop below $1,037 could trigger a sharp fall toward $824, aligning with the measured height of the double-top formation — roughly 24% below the current price.
Conversely, if bulls manage to push BNB above $1,111, it would invalidate the bearish setup and open the door for a potential rally toward $1,150.
Summary
BNB currently stands at a crossroads between confirming a bearish continuation and sparking a potential reversal fueled by renewed investor confidence.
While listings on Robinhood and Coinbase have brought optimism back to the market, the token must reclaim $1,111 to escape the shadow of the double-top and regain bullish momentum.
#bnb , #Binance , #CryptoAnalysis , #CryptoMarket , #Altcoin
Stay one step ahead – follow our profile and stay informed about everything important in the world of cryptocurrencies!
Notice:
,,The information and views presented in this article are intended solely for educational purposes and should not be taken as investment advice in any situation. The content of these pages should not be regarded as financial, investment, or any other form of advice. We caution that investing in cryptocurrencies can be risky and may lead to financial losses.“
