Here is a detailed technical analysis of Ethereum (ETH/USD) for the 4-hour timeframe 👇
🔹 Chart Overview
Time Frame: 4 Hours
Current Price: ≈ 3,983
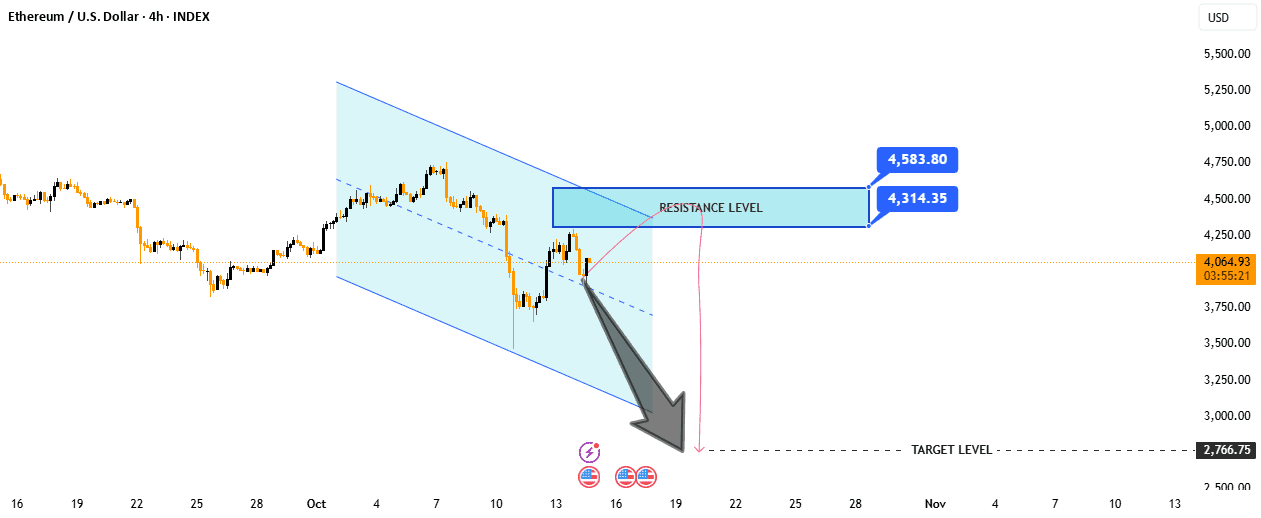
Resistance Area: 4,314 – 4,583
Target Level: 2,766
Pattern: Descending Channel (Continued Downtrend)
🔹 Price Structure
The price is moving within a descending channel, indicating that the overall trend is still bearish.
After touching the lower line of the trend, ETH bounced back and is now testing the resistance area of the upper channel between 4,314–4,583.
🔹 Key levels
Resistance area:
This area is critical; it aligns with both the upper channel limits and the previous supply area.
If the price is rejected here → confirms the continuation of the downward trend.
Support / target:
The expected target level is around 2,766.75, which aligns with the lower channel boundary extension.
🔹 Market bias
As long as ETH remains below 4,314, negative sentiment prevails.
Clean breakout and close above 4,583 will invalidate the bearish setup and may shift sentiment to bullish towards 4,800+.
🔹 Potential scenarios
1. Bearish scenario (high probability):
ETH rejects from the resistance area (4,314–4,583).
The downward movement continues towards 3,500 → 3,000 → final target 2,766.
2. Bullish reversal (low probability unless a breakout occurs):
Strong breakout above 4,583 with volume.
Next resistance near 4,950–5,000.
🔹 Summary
📉 Trend: Bearish
⚠ Watch area: 4,314–4,583 (short opportunity if rejection occurs)
🎯 Lower side target: 2,766
🔄 Invalidated: Break and close above 4,583