________________________________________
📊 BTC/USDT Analysis
1. Price Forecast
• Short-term (1–2 days): with the current RSI (15m = 33.97 / 1h = 41.44) the market is in a zone close to oversold. A technical pullback upwards to the area of 121,500–123,200 is expected.
• Medium-term (3–7 days): if it holds above 120,000, growth to 124,000–126,500 is possible. With a breakout down at 119,400 – a decline to 117,500–116,200.
________________________________________
2. Levels
Support: 120,300 / 119,400 / 118,000 / 116,200
Resistance: 121,500 / 123,200 / 124,000 / 126,500
________________________________________
3. Long Scenario
• Entry: 120,300 – 121,000
• Take-profits: 121,500 → 122,200 → 123,200 → 124,000 → 126,500
• Stop-loss: • It is more optimal to set a stop in the range of 119,100–119,200 while maintaining risk management.
• Leverage: optimally 3–5x (higher risks at 10x, as the stop level is close).
• Probability of implementation: ~65% (considering RSI and liquidation zones at 120,000).
________________________________________
4. Short Scenario
• Entry: during a pullback to the resistance zone 123,200–124,000
• Take-profits: 122,200 → 121,500 → 120,500 → 119,400
• Stop-loss: 124,800
• Leverage: safely 3–5x, aggressively 7–10x
• Probability of implementation: ~35% (lower, as the market is oversold down and a pullback is expected).
________________________________________
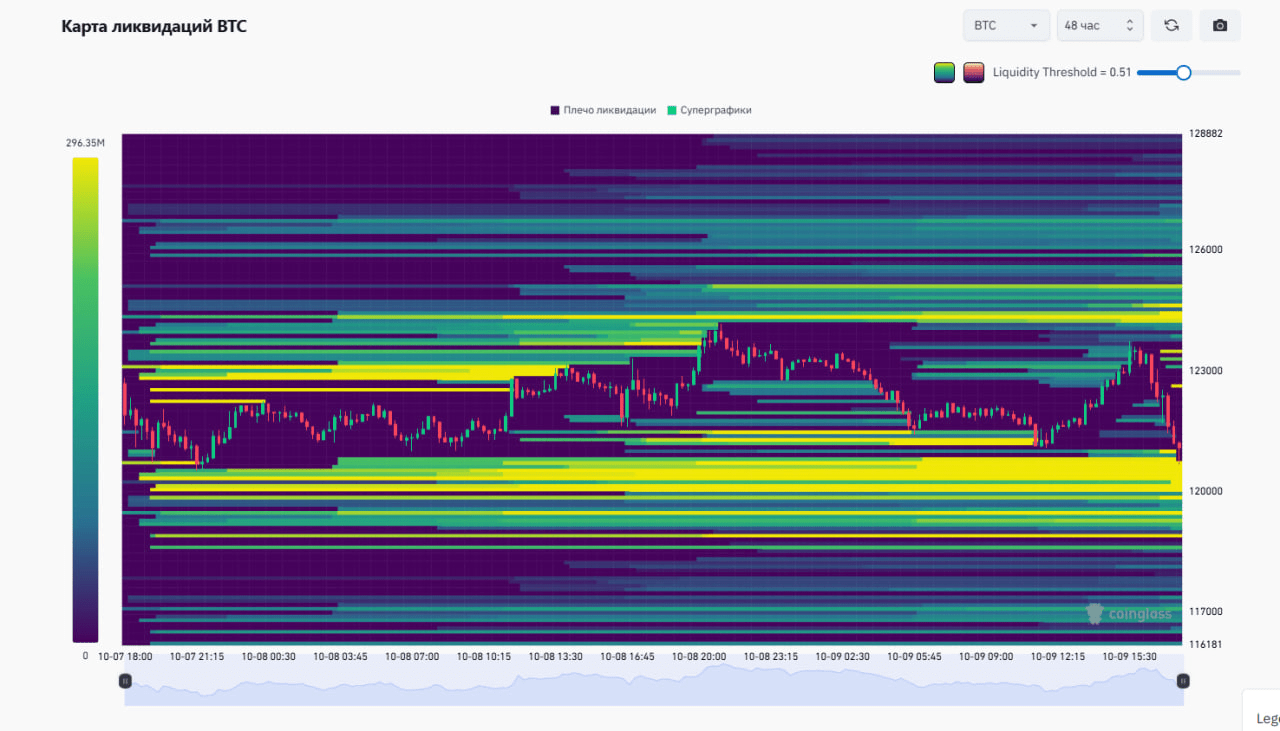
5. Conclusion
• The main priority is long from the zone 120,300–121,000 with targets up to 126,500.
• Short is reasonable only from strong resistance (123,200–124,000).
• The current liquidation map shows dense liquidation clusters at the bottom (119,800–120,200), which increases the likelihood of a bounce up.👉The trading strategy was created using ChatGPT (analysis of the liquidation map + RSI)
➡️@INVESTIDEAUA : Intraday trading, LONG/SHORT strategies, SPOT, TRAINING (how to use ChatGPT to create trading strategies)#ОбучениеТрейдингу