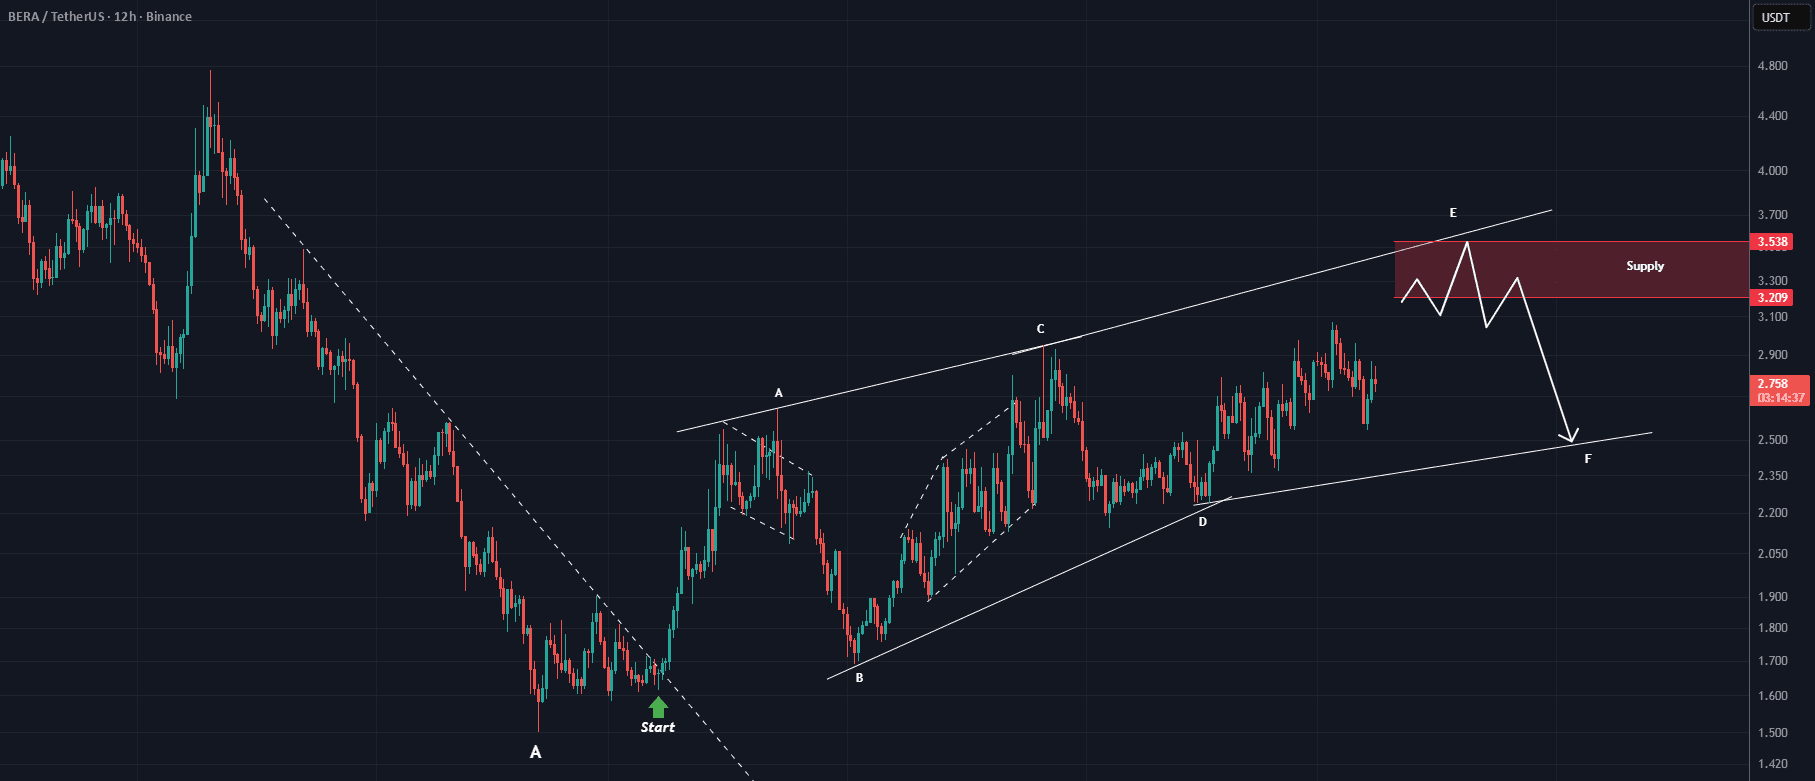
Will wave F complete soon? 🎯🔥🚀
Since the point indicated by the green arrow on the chart, the currency $BERA started a corrective phase after a strong previous downtrend.
The current pattern appearing on the chart seems tilted or symmetrical, which is a technical signal indicating the possibility of a temporary rebound before continuing the main trend, which still has a bearish character in the short term.
---
🔍 Technical reading $BERA :
Overall trend: corrective within a descending channel.
Pattern: Wave F within a complex corrective pattern (likely nearing completion).
Technical indicators:
Weakness in the upward momentum according to RSI.
Possible negative crossover on MACD confirms loss of buying power.
---
🎯 Proposed trading strategy:
❌ Buying is not recommended at this time due to the price approaching the red resistance zone.
🔻 Potential sell opportunity when the price enters the specified red area on the chart, which is where wave F is expected to complete and a new downward wave begins.
---
🛑 Scenario cancellation:
If the daily candle closes above the specified cancellation level (the main resistance), this invalidates the bearish scenario and indicates the potential beginning of a new upward trend.
---
📌 Capital management:
🛡️ Place a strict stop loss just above the cancellation level.
💰 Upon reaching the first target, secure part of the profits and move the stop loss to the entry point to safeguard the trade.
---
⚠️ Important reminder:
> This analysis reflects a purely technical reading based on patterns and indicators,
and not a direct financial recommendation to buy or sell.
Trading is always a personal responsibility, and strict risk management should be relied upon.
