
The price $XRP broke through a major weekly resistance level, surpassing a downward trend line that lasted for months.
The breakout indicates the completion of a long-term corrective phase, according to 'Dark Defender' analysis.
This structure had limited price heights for a while, and represents a five-legged pattern A-B-C-D-E on the chart.
This movement allows the possibility of starting a new upward trend.
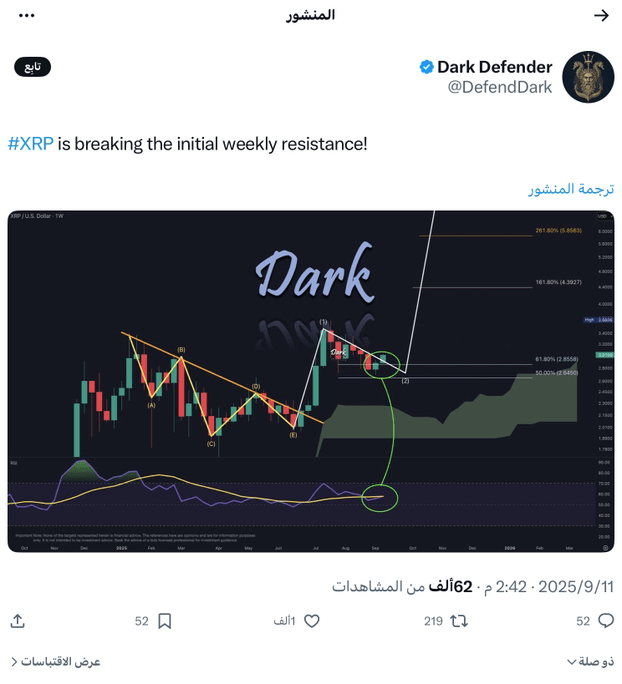
According to Elliott wave analysis, the first wave has completed while the second wave retraced to a correction area between $2.65 and $2.86, matching the Fibonacci levels of 50% and 61.8%, which often indicate reversal points before the third wave rises.
The price of $XRP reached $3.03 at the time of publication, recording an increase of 2% over 24 hours and 9% over the week, with a trading volume of nearly 6 billion dollars.
The Relative Strength Index (RSI) also showed a bullish divergence, as the price recorded a lower low while the indicator rose, indicating a potential shift in momentum.
Key levels and potential trend:
Next resistance level: $3.65
Advanced targets based on Fibonacci extensions: $4.39 and $5.85
The daily analysis indicates that Ripple closed above the short-term resistance level at $3.0452, which could provide momentum towards $3.65.
According to analyst Ali Martinez, there are two potential paths:
Breaking the level of $3.05 and rising towards $3.6.
Returning to $2.8, then breaking $2.9, before rising to $3.6.
Whale wallets sold more than 120 million dollars of $XRP in 24 hours, but the price stabilized and maintained the level of $3 before rising towards $3.10, reflecting strong demand and buyer stability despite large sell-offs.
The overall market continues, especially Bitcoin's movement affecting Ripple in the short term, but current indicators support the expectation of continued upward trend if buyers maintain their strength.
#Xrp🔥🔥 #BinanceXRP #BinanceSquare #BinanceSquareFamily #Write2Earn