

SOL’s breakout above $179.97 suggests bullish momentum, eyeing the $190–$200 resistance zone.
Clearing $200 could open targets at $215, $240, and the $295.11 cup rim.
RSI at 59.78 and MACD crossover point to strengthening upward momentum.
Solana’s price action has shown a decisive technical breakout. According to analyst Ali, the move follows a textbook cup and handle pattern that has been forming since late 2021. The left side of the cup developed after a sharp drop from peak levels, with SOL bottoming near $8.00 in late 2022. A recovery lasting into 2024 completed the right side, pushing prices toward the $295.11 resistance, the cup’s rim.
Handle Breakout and Immediate Price Action
After hitting the high, SOL entered a descending channel between early and mid 2025, forming the handle. Prices dipped to around $130.00 before reversing. The recent breakout above the handle’s trendline, with SOL closing at $179.97 for the week, marked an 11.15% gain. This movement suggests strengthening bullish momentum. The price is now approaching the $190–$200 resistance area, a technical and psychological barrier.
Key Technical Levels and Targets
The cup rim remains a major resistance at $295.11. A confirmed move above that level could align with the measured pattern targets. Based on Fibonacci extensions, the first target is near $787.43, with a more aggressive projection at $1,314.41.
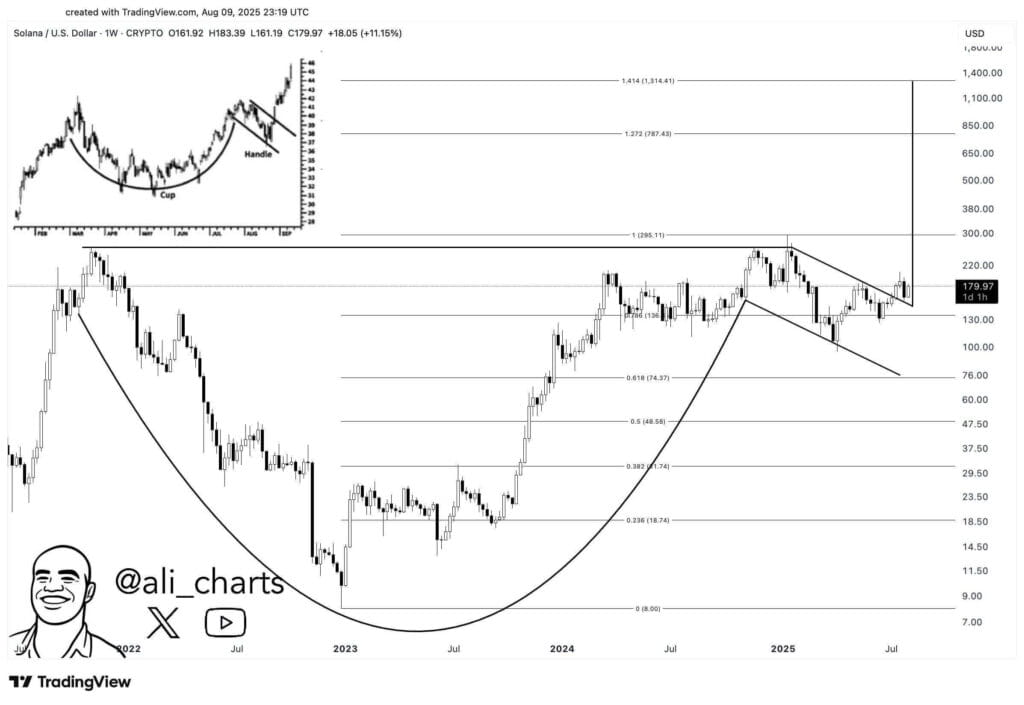 SOL/USD 1-week price chart, Source: Ali on X
Shorter term, breaking above $200 could lead to potential tests at $215 and $240, both aligning with prior resistance zones. However, failure to clear $190–$200 may prompt profit taking, sending prices toward the $170–$160 support range.
Indicators Point to Bullish Bias
Momentum indicators currently support the bullish outlook. The RSI is at 59.78, above the 50.11 signal line, indicating growing buying pressure. While not yet overbought, movement toward the 65–70 range could precede further gains.
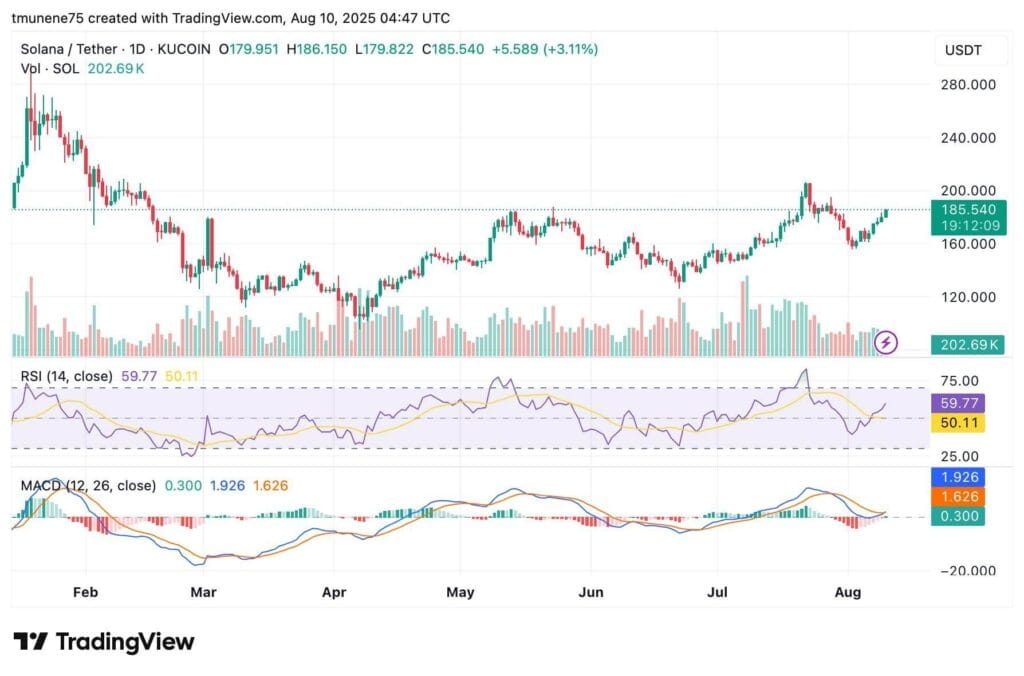 SOL/USDT 1-day price chart, Source: TradingView
The MACD line is at 1.928, ahead of its 1.626 signal line, with a positive histogram reading of 0.301. This bullish crossover indicates a strengthening uptrend. Additionally, trading volume reached 202.71K USDT-equivalent, suggesting healthy activity, though not yet at breakout levels.
The post Solana Price Breakout Could Push Toward $1,315, Says Analyst appears on Crypto Front News. Visit our website to read more interesting articles about cryptocurrency, blockchain technology, and digital assets.
