

XRP dropped 20% from $3.55 highs, now testing $2.70–$2.87 support amid diminishing momentum and bearish technical indicators.
RSI at 43.35 and MACD bearish crossover confirm weakening trend; further dip may target $2.40–$2.60 zone.
Price outlook stays bullish above $2.60, but a break lower could lead to a fall toward $2.00 or $1.82 support levels.
XRP is undergoing a deep correction after rallying to highs above $3.55 in July. The pullback began shortly after the digital asset surged from around $1.82, posting a 126.43% gain. The current retracement has erased nearly 20% from the peak, with XRP now trading at $2.81.
According to Michael van de Poppe, the recent high was “a tricky one” and losing key levels led to this correction. He emphasized that if the dip continues, the $2.40–$2.60 zone may become a key point for fresh interest.
XRP still holds above the $2.60–$2.80 support region. The $2.80 level, in particular, was noted in prior analysis as “an important level to hold” to avoid further downside. The broader trend is bullish, but current momentum has weakened significantly. Despite that, trading volume has declined only slightly compared to July.
Indicators Show Diminishing Momentum
Technical indicators align with the current correction. The RSI, which previously peaked above 70, has dropped to 43.35. This level suggests neutral to mildly bearish conditions as the overbought pressure continues to ease.
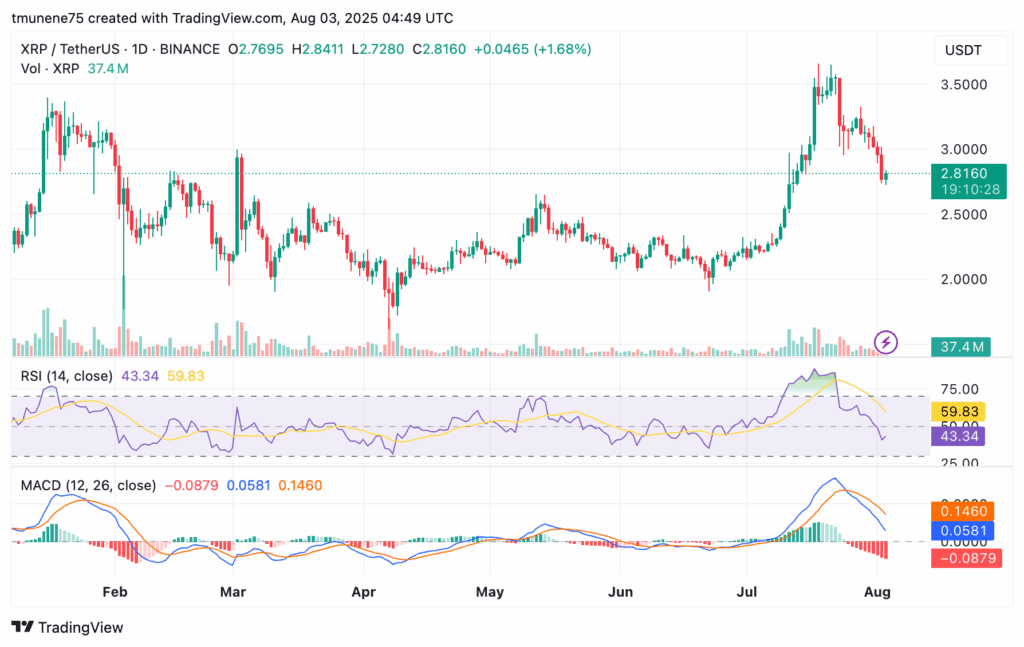 XRP/USDT 1-day price chart, Source: TradingView
A recent bearish crossover between the RSI and its moving average, now at 59.83, further supports this slowdown. Moreover, the MACD also confirms the declining momentum. The MACD line now is at 0.0581 while the signal line has moved ahead to 0.1460.
The negative histogram reading of −0.0879 shows growing bearish pressure. Together, these signals imply that XRP could remain under pressure unless new bullish catalysts emerge.
Key Support Zones as Price Seeks Stability
The price now tests the lower end of the $2.70–$2.87 zone. Analysts mark this region as key in avoiding a move toward deeper support levels. If buyers fail to defend this area, XRP could fall into the $2.40–$2.60 gray zone.
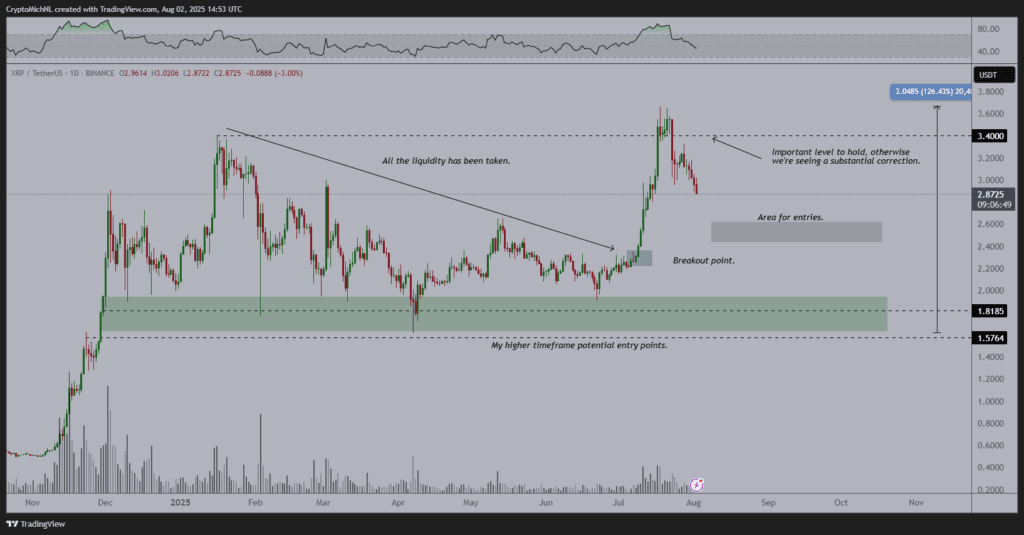 XRP/USDT 1-day price chart, Source: Michael Van de Poppe on X
This level has been labeled as a potential entry area, especially if the correction intensifies. Deeper still, the $2.00–$2.20 breakout zone may act as a secondary support. Historical data shows that this range was key in flipping the market structure bullish.
Below that, the $1.82–$1.57 range remains the major demand zone. It has acted as a strong support several times in the past and is noted for high timeframe entries.
Price Action Points to Short Term Weakness But Structure Holds
The broader structure still shows a bullish trend. However, the current cooling phase requires XRP to hold above $2.60. Falling below this level could drag price toward the previously tested $2.00 zone.
While the current RSI and MACD trends show fading momentum, stabilization above $2.70 may offer a base for recovery. Trading volume is moderate at 37.4 million, slightly down from July peaks.
As volume drops during pullbacks, this often suggests temporary consolidation. However, without renewed buyer strength, XRP may continue to drift lower before testing major demand zones again.
The post XRP Correction Deepens as Analyst Eyes $2.40–$2.60 Zone for Recovery appears on Crypto Front News. Visit our website to read more interesting articles about cryptocurrency, blockchain technology, and digital assets.
