
$SOL broke above $178 with strong 4H chart momentum, confirming a bullish ascending triangle breakout toward the $300–$360 range.
Fibonacci levels at 1.618 and 2.0 place Solana’s next technical targets near $297.65 and $360.76 if volume continues rising.
Solana’s DeFi TVL jumped to $10.45B, the highest since January, reflecting ecosystem growth that mirrors the token’s bullish price action.
Solana (SOL) has crossed above a major resistance zone officially, and this indicates that the bullish cycle is yet to end. The rising power shows on the current price action, which is backed by the technical patterns and higher volume.
Ascending Triangle Breakout Confirms Bullish Structure
Solana’s price action on the 4-hour chart reveals a breakout from an ascending triangle formation. The horizontal resistance level at approximately $178 has been decisively breached, pushing the token’s value to $203.27 at the time of reporting.
Ali charts highlighted this move, noting the breakout was supported by a surge in volume. According to his chart analysis, Fibonacci extension levels place the next price targets at $297.65 and $360.76. These correspond to the 1.618 and 2.0 Fibonacci levels, giving a technical framework for the projected $300–$360 range
.
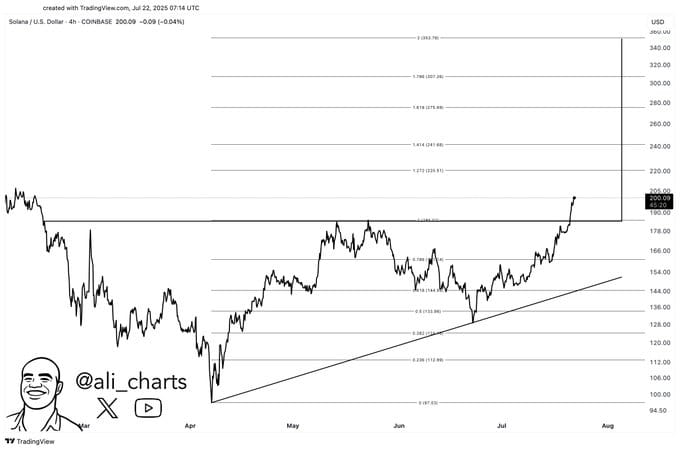 Source: Ali Charts
The triangle pattern took shape over Q2, with ascending trendline support originating from early April. This structure suggests sustained accumulation before a sharp upward move in late July. With the resistance ceiling removed, Solana has now entered price discovery.
Technical Momentum Aligns with Volume and Fibonacci Levels
The bullish expression was supported by the strong trading volume as the upward breakout was gained. Fibonacci extensions provide clearly defined price zones that traders may target in the near term.
The bullish continuation pattern formed over several months and now appears to be resolving to the upside. The price of SOL has risen by 1.62% in the past 24 hours and 21.29% over the last 7 days, reaching a current value of $203.27.
The technical setup suggests that the $300–$360 range is not only a target zone but also a natural extension based on previous accumulation. If the current momentum holds, the trend could sustain over the coming weeks.
Solana DeFi Strength Mirrors Price Breakout
Tom Tucker noted that Solana’s total value locked (TVL) has climbed to $10.45 billion, its highest since January. This metric indicates growing investor confidence in the ecosystem, tracking closely with the recent price movement.
https://twitter.com/WhatzTheTicker/status/1947679491746140497
The resurgence in DeFi activity supports Solana’s bullish trajectory. The alignment between ecosystem strength and token performance reinforces the broader trend. With rising TVL and volume, the network’s activity appears synchronized with the recent technical breakout.
The post Can Solana Reach $360 After Breaking Out of Its Triangle Pattern? appears on Crypto Front News. Visit our website to read more interesting articles about cryptocurrency, blockchain technology, and digital assets.
