

Ethereum forms bearish RSI divergence and breaks rising wedge, risking a drop toward $3,150 amid rising profit taking.
Liquidity zone at $3,150 could lead to long liquidations; further downside may target $2,800–$2,233 if selling pressure persists.
MACD shows fading momentum; high volume red candles indicate possible distribution as short term caution builds.
Ethereum recent rally is losing steam after weeks of upward movement. The price surged from early May levels below $2,000 to a local high of $3,850 by mid July. However, a short term reversal has now begun, and current market outlook suggests a potential pullback is underway.
At the time of reporting, Ethereum was trading at $3,700, a slight drop of 0.30% in the past 24 hours. A rising wedge pattern on the daily timeframe has broken down, adding further downside pressure. Notably, analysts are watching for a drop into lower support zones as profit-taking continues to build momentum.
Rising Wedge Breakdown and Liquidity Concerns
A rising wedge had formed from early July, starting near $2,400. This pattern often precedes bearish moves, and Ethereum has now dropped below its lower trendline. At the same time, the RSI printed a bearish divergence.
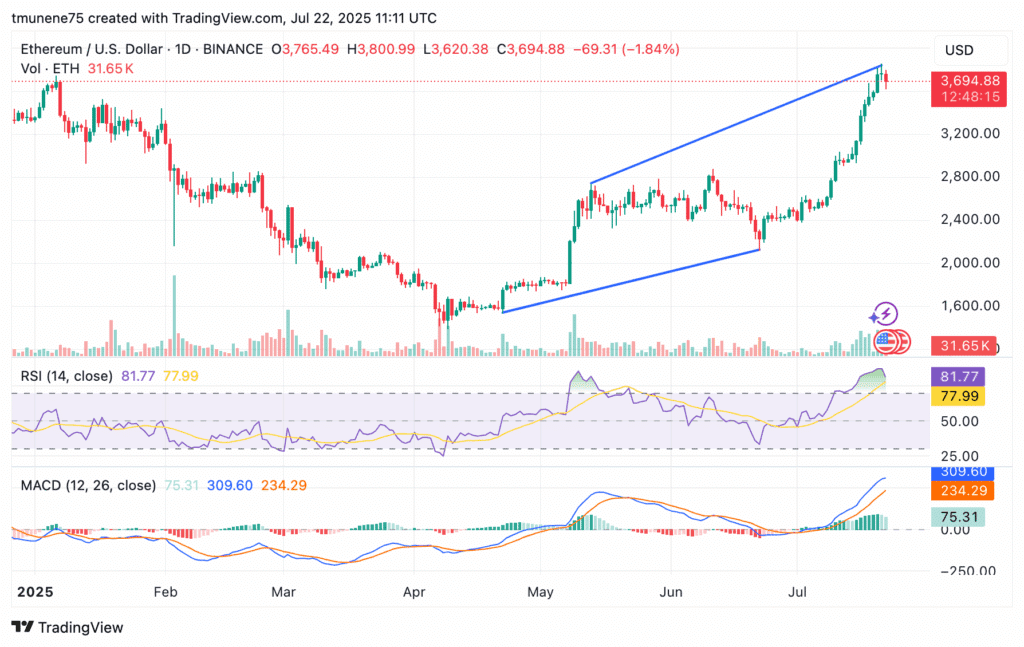 ETH/USD 1-day price chart, Source: TradingView
This is evident because price made higher highs, but RSI formed lower highs. This divergence pointed to weakening bullish strength as Ethereum topped out near $3,850. Current RSI has pulled back from a peak of 81.77, previously deep in overbought levels.
A marked liquidity zone is near $3,150, where many long side positions and stop losses are concentrated. A drop to this level, representing a 12.83% decline from local highs, would flush leveraged positions and reset the trend structure.
Volume, Momentum Indicators Suggest Distribution Phase
Alongside the wedge breakdown, volume has notably increased. The recent red candle was matched with high volume, hinting at possible distribution near the top. Although the MACD remains bullish, reading 309.60 against a signal line of 234.29, its sharp curve and histogram suggest overextension.
Any slowing or crossover may confirm the ongoing correction phase. Ethereum remains above its immediate support between $3,200 and $3,400. However, sustained downside pressure could push the price lower toward $2,800, aligning with the bottom of the wedge structure.
Lower Support Levels and Broader Price Outlook
If Ethereum slides below $3,150, several historical levels come into focus. The zone at $2,630.16 served as resistance in early July before the breakout. Below that, $2,403.47 marked a major consolidation area, followed by $2,233.80, which had previously acted as long term support. These levels now represent potential bounce zones if current selling extends.
Ethereum’s short term outlook shows growing caution across technical indicators. While the broader trend remains intact, recent developments suggest a shift toward consolidation as momentum fades.
The post Ethereum Set for Violent Correction as Market Cools Below $3,850 Peak, Says analyst appears on Crypto Front News. Visit our website to read more interesting articles about cryptocurrency, blockchain technology, and digital assets.
