If you've ever seen a crypto chart, you've seen technical indicators. The Relative Strength Index (RSI) is one of the most popular and easiest to understand tools for seeing if a coin is getting too hot or too cold.
What is the RSI in Simple Terms?
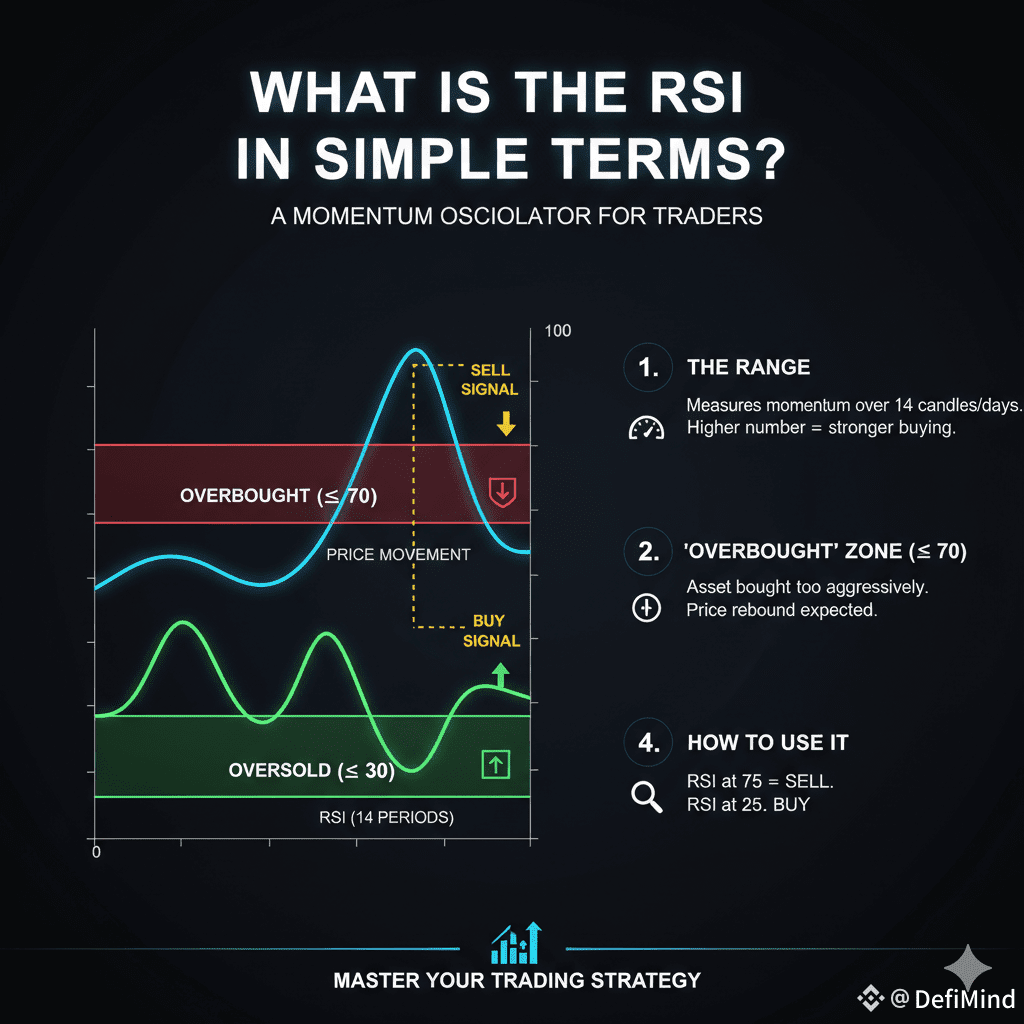
The RSI is a momentum oscillator—it measures the speed and change of price movements. It plots a line that moves between 0 and 100.
1. The Range: The RSI measures momentum over a set period (usually the last 14 candles/days). The higher the number, the stronger the buying pressure.
2. The 'Overbought' Zone (>= 70): When the RSI is at 70 or higher, it suggests the asset has been bought too aggressively and is overbought. A price drop is often expected soon.
3. The 'Oversold' Zone (=< 30): When the RSI is at 30 or lower, it suggests the asset has been sold too aggressively and is oversold. A price rebound is often expected soon.
4. How to Use It: Traders use the RSI to look for reversals. Seeing the RSI hit 75 can be a signal to sell (or avoid buying). Seeing it hit 25 can be a signal to look for a good entry.
⚠️ Pro Tip: Never use the RSI alone! Combine it with support and resistance levels for a more reliable trade setup.