🧭 1. Structure Overview
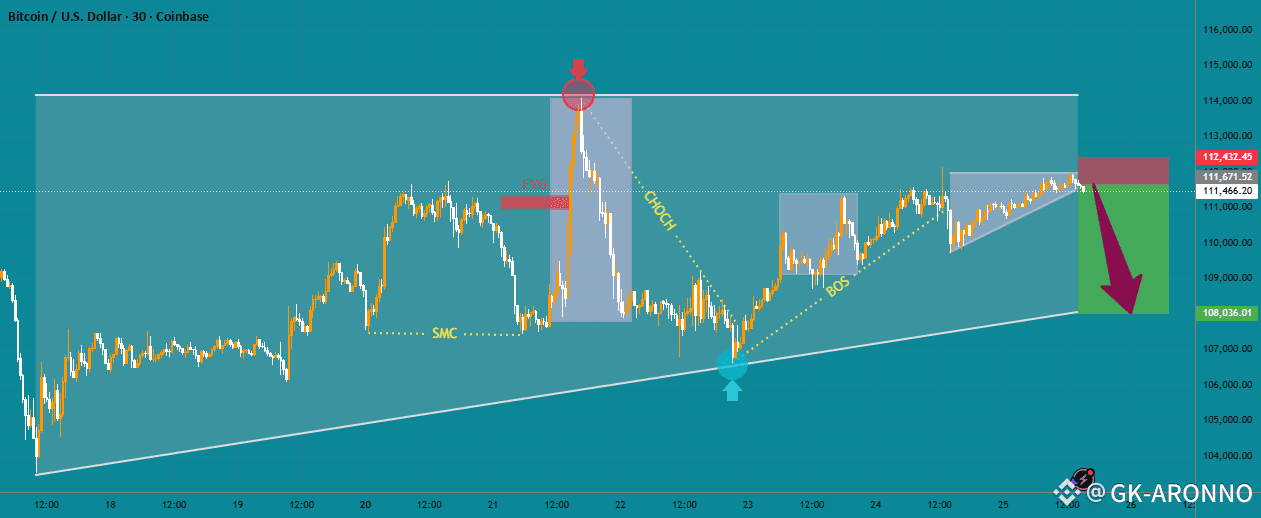
The chart shows a bullish structure with ascending lows (trendline support 📈).
However, near the recent high zone (~112,400–114,000), we see signs of distribution and liquidity sweep before a potential reversal.
🔍 2. Key SMC Elements Identified
🟢 CHoCH (Change of Character):
After the strong impulse up, a CHoCH formed (yellow label) indicating a shift from bullish to potential bearish bias.
🟣 BOS (Break of Structure):
Price confirmed BOS after breaking below the previous higher low — signaling sellers entering the market.
🟥 FVG (Fair Value Gap):
A bearish FVG appeared around 112,000–113,000, acting as a supply zone 🔺 where price retraced before rejecting again.
🟦 SMC Zone:
The earlier accumulation zone around 109,000–110,000 shows strong demand — possible buy-side re-entry if liquidity below is swept.
💧 3. Liquidity Zones
Buy-Side Liquidity: Swept near 114,000, triggering short entries 🎯.
Sell-Side Liquidity: Resting below 108,000–109,000, likely target area for downside continuation 💧.
⚙️ 4. Price Action Bias
Current rejection from the bearish FVG + BOS confirmation implies bearish momentum 📉.
Expect short-term correction toward 108,000 before next structure shift or accumulation.