
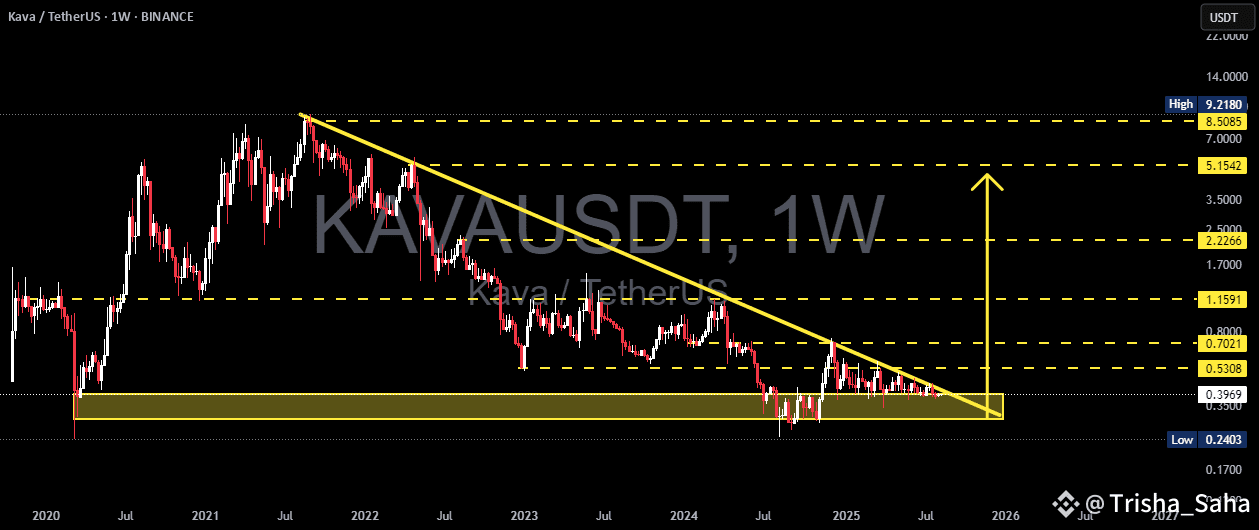
KAVA price is forming a descending triangle on the weekly timeframe, with a long-term downtrend resistance line from the 2021 peak converging toward a horizontal support zone (~0.24–0.40). Price action is compressing near the apex — suggesting that a strong move (either breakout or breakdown) could occur in the coming weeks/months. Weekly timeframe signals carry more weight, so confirmation on a weekly close is highly recommended.
Key Levels (from chart)
Resistance / upside targets: 0.5308 → 0.7021 → 1.1591 → 2.2266 → 5.1542 → 8.5085 → 9.2180
Current price (chart): ~0.3972
Key support zone (yellow box): ~0.24 (Low 0.2403) to ~0.40
Pattern & Technical Interpretation
Pattern: Descending triangle — series of lower highs (downward sloping trendline) + horizontal support.
Implication: In a long-term downtrend, descending triangles often act as bearish continuation patterns. However, a confirmed breakout above the trendline can also signal a bullish reversal.
Compression & timing: Price is nearing the apex → expect volatility to spike once a breakout/breakdown occurs.
Bullish Scenario (confirmation needed)
1. Trigger: Weekly close above the descending trendline (break & hold), ideally followed by a successful retest as support.
2. Extra confirmation: Weekly close above 0.5308 would strengthen the bullish case.
3. Targets: 0.53 → 0.70 → 1.16 (next major resistance zones). If momentum remains strong, higher targets like 2.22 and beyond come into play.
4. Entry strategy: Post-breakout entry after weekly close confirmation, or aggressive scaling in at support with a tight stop-loss.
Bearish Scenario (confirmation needed)
1. Trigger: Weekly close below the support zone (~0.24–0.40), especially with a large breakdown candle.
2. Implication: Breakdown from a descending triangle often accelerates selling pressure — potential retest of historical lows (around or below 0.2403).
3. Entry strategy: Short positions only after confirmed breakdown; conservative longs should avoid entries until reversal signs appear.
Trading Plan & Risk Management (principles)
Always wait for weekly confirmation to avoid false breakouts.
Stop-loss for aggressive longs: just below the support zone (e.g., under 0.24). For breakout longs: below the retested trendline support.
Position sizing: manage exposure due to weekly timeframe + high crypto volatility.
Take profit progressively at major horizontal resistance levels (0.53, 0.70, 1.16…).
Beware of fakeouts — watch for candle closes and retests.
Additional Notes
Weekly timeframe setups tend to be stronger but slower to play out.
Monitor KAVA fundamentals and overall crypto market sentiment (especially BTC trend) — these can speed up or reverse a breakout.
If posting to TradingView, include these levels and clearly state your breakout/breakdown confirmation criteria.
#KAVA #KAVAUSDT #TechnicalAnalysis #SupportResistance #Breakout