
Stellar’s native token XLM has trended steadily downward since reaching a local cycle peak of $0.52 on July 18.
Now trading around $0.39, the altcoin has lost 14% of its value in just over two weeks, as bearish sentiment gathers pace heading into a historically difficult month for the token.
XLM’s August Curse Returns With Sell Signals Mounting
A review of XLM’s monthly returns reveals a worrying pattern. August has only delivered a positive monthly close twice—in 2017 and 2021. Every other August has ended in the red.
For token TA and market updates: Want more token insights like this? Sign up for Editor Harsh Notariya’s Daily Crypto Newsletter here.
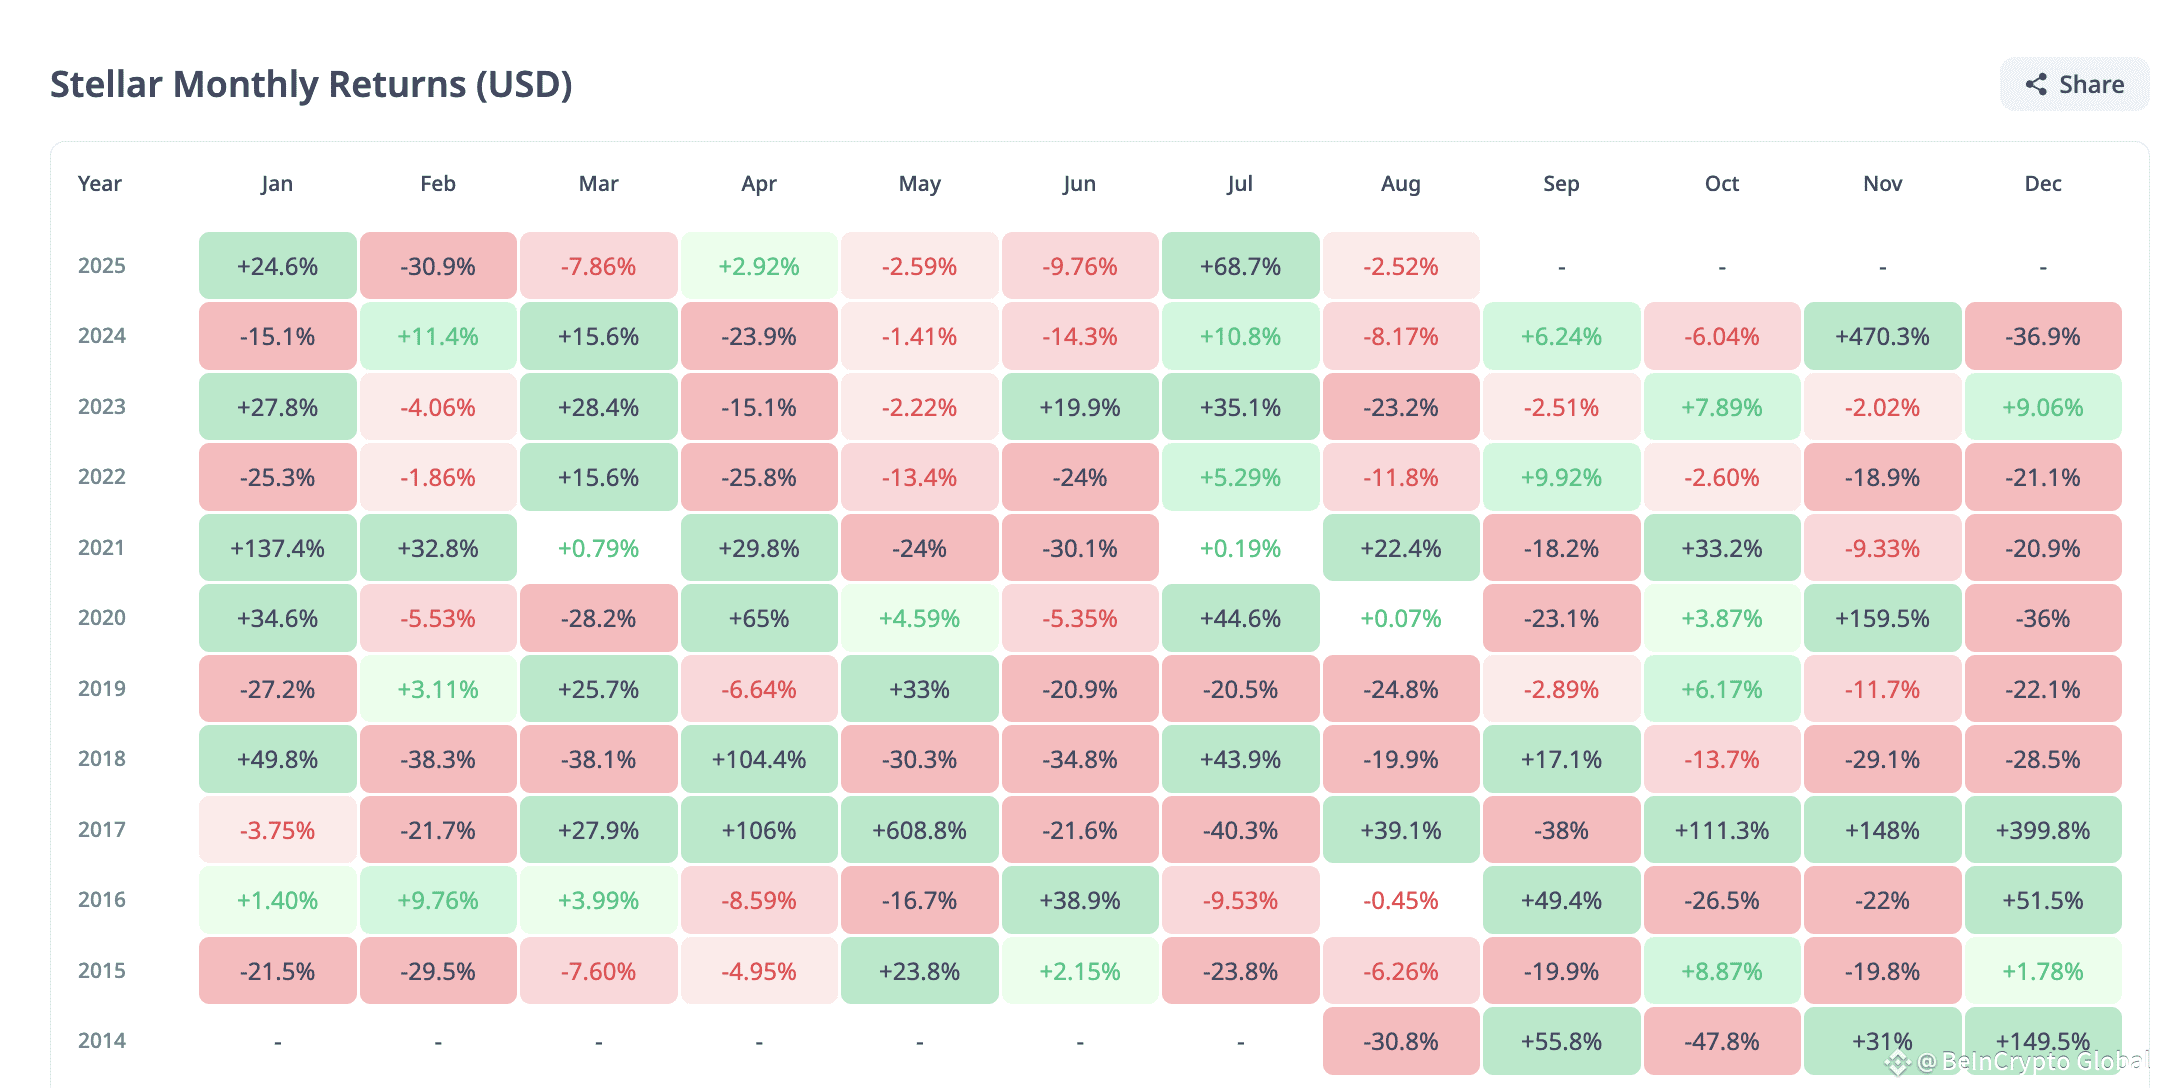 Stellar Monthly Returns. Source: CryptoRank
This track record now intersects with weakening technical indicators, setting the stage for a potential downward trend continuation as a new month commences.
Readings from the XLM/USD one-day chart show that the double-digit dip in the token’s value has pushed its price below its 20-day Exponential Moving Average (EMA). This key moving average forms dynamic resistance above XLM at $0.40 at press time.
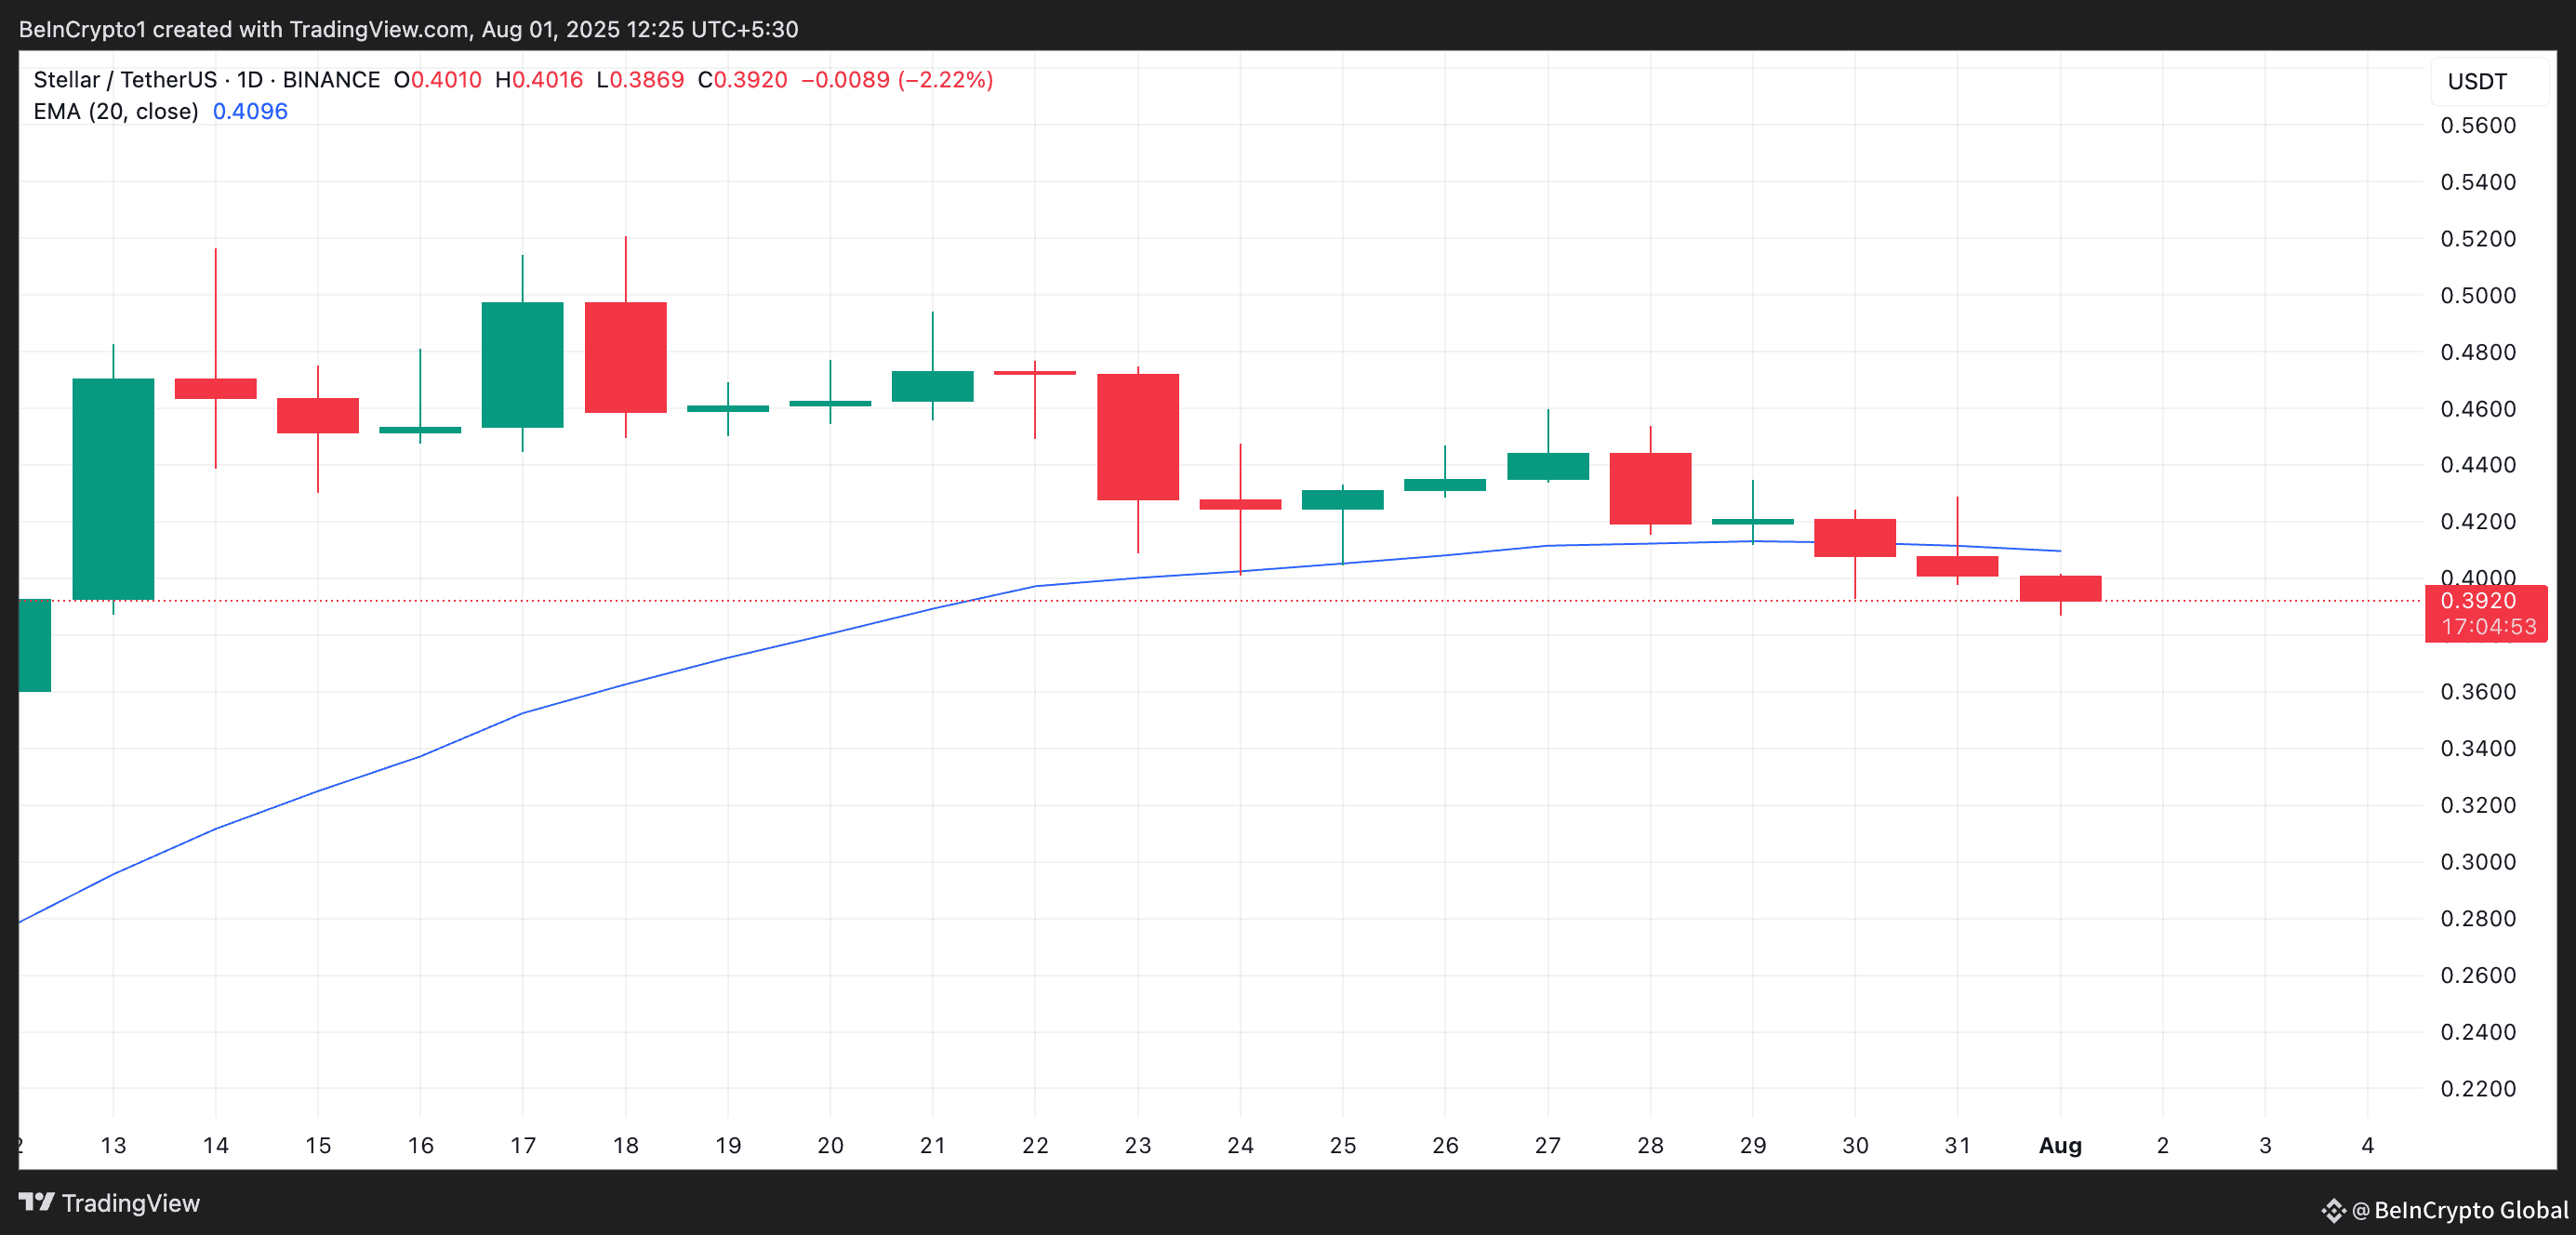 XLM 20-Day EMA. Source: TradingView
The 20-day EMA measures an asset’s average price over the past 20 trading days, giving weight to recent prices. When the price trades above the EMA, it signals short-term bullish momentum and suggests buyers are in control.
Converesly, when an asset’s price breaks below its 20-day EMA, it represents a shift in short-term market sentiment from bullish to bearish. It reflects increasing sell-side, especially when accompanied by other bearish indicators.
Adding to this bearish outlook, XLM’s Chaikin Money Flow (CMF) has slipped below the zero line—another red flag that hints at a sustained decline this August. The CMF reading sits at -0.03 at press time, indicating a net capital outflow from XLM’s spot markets.
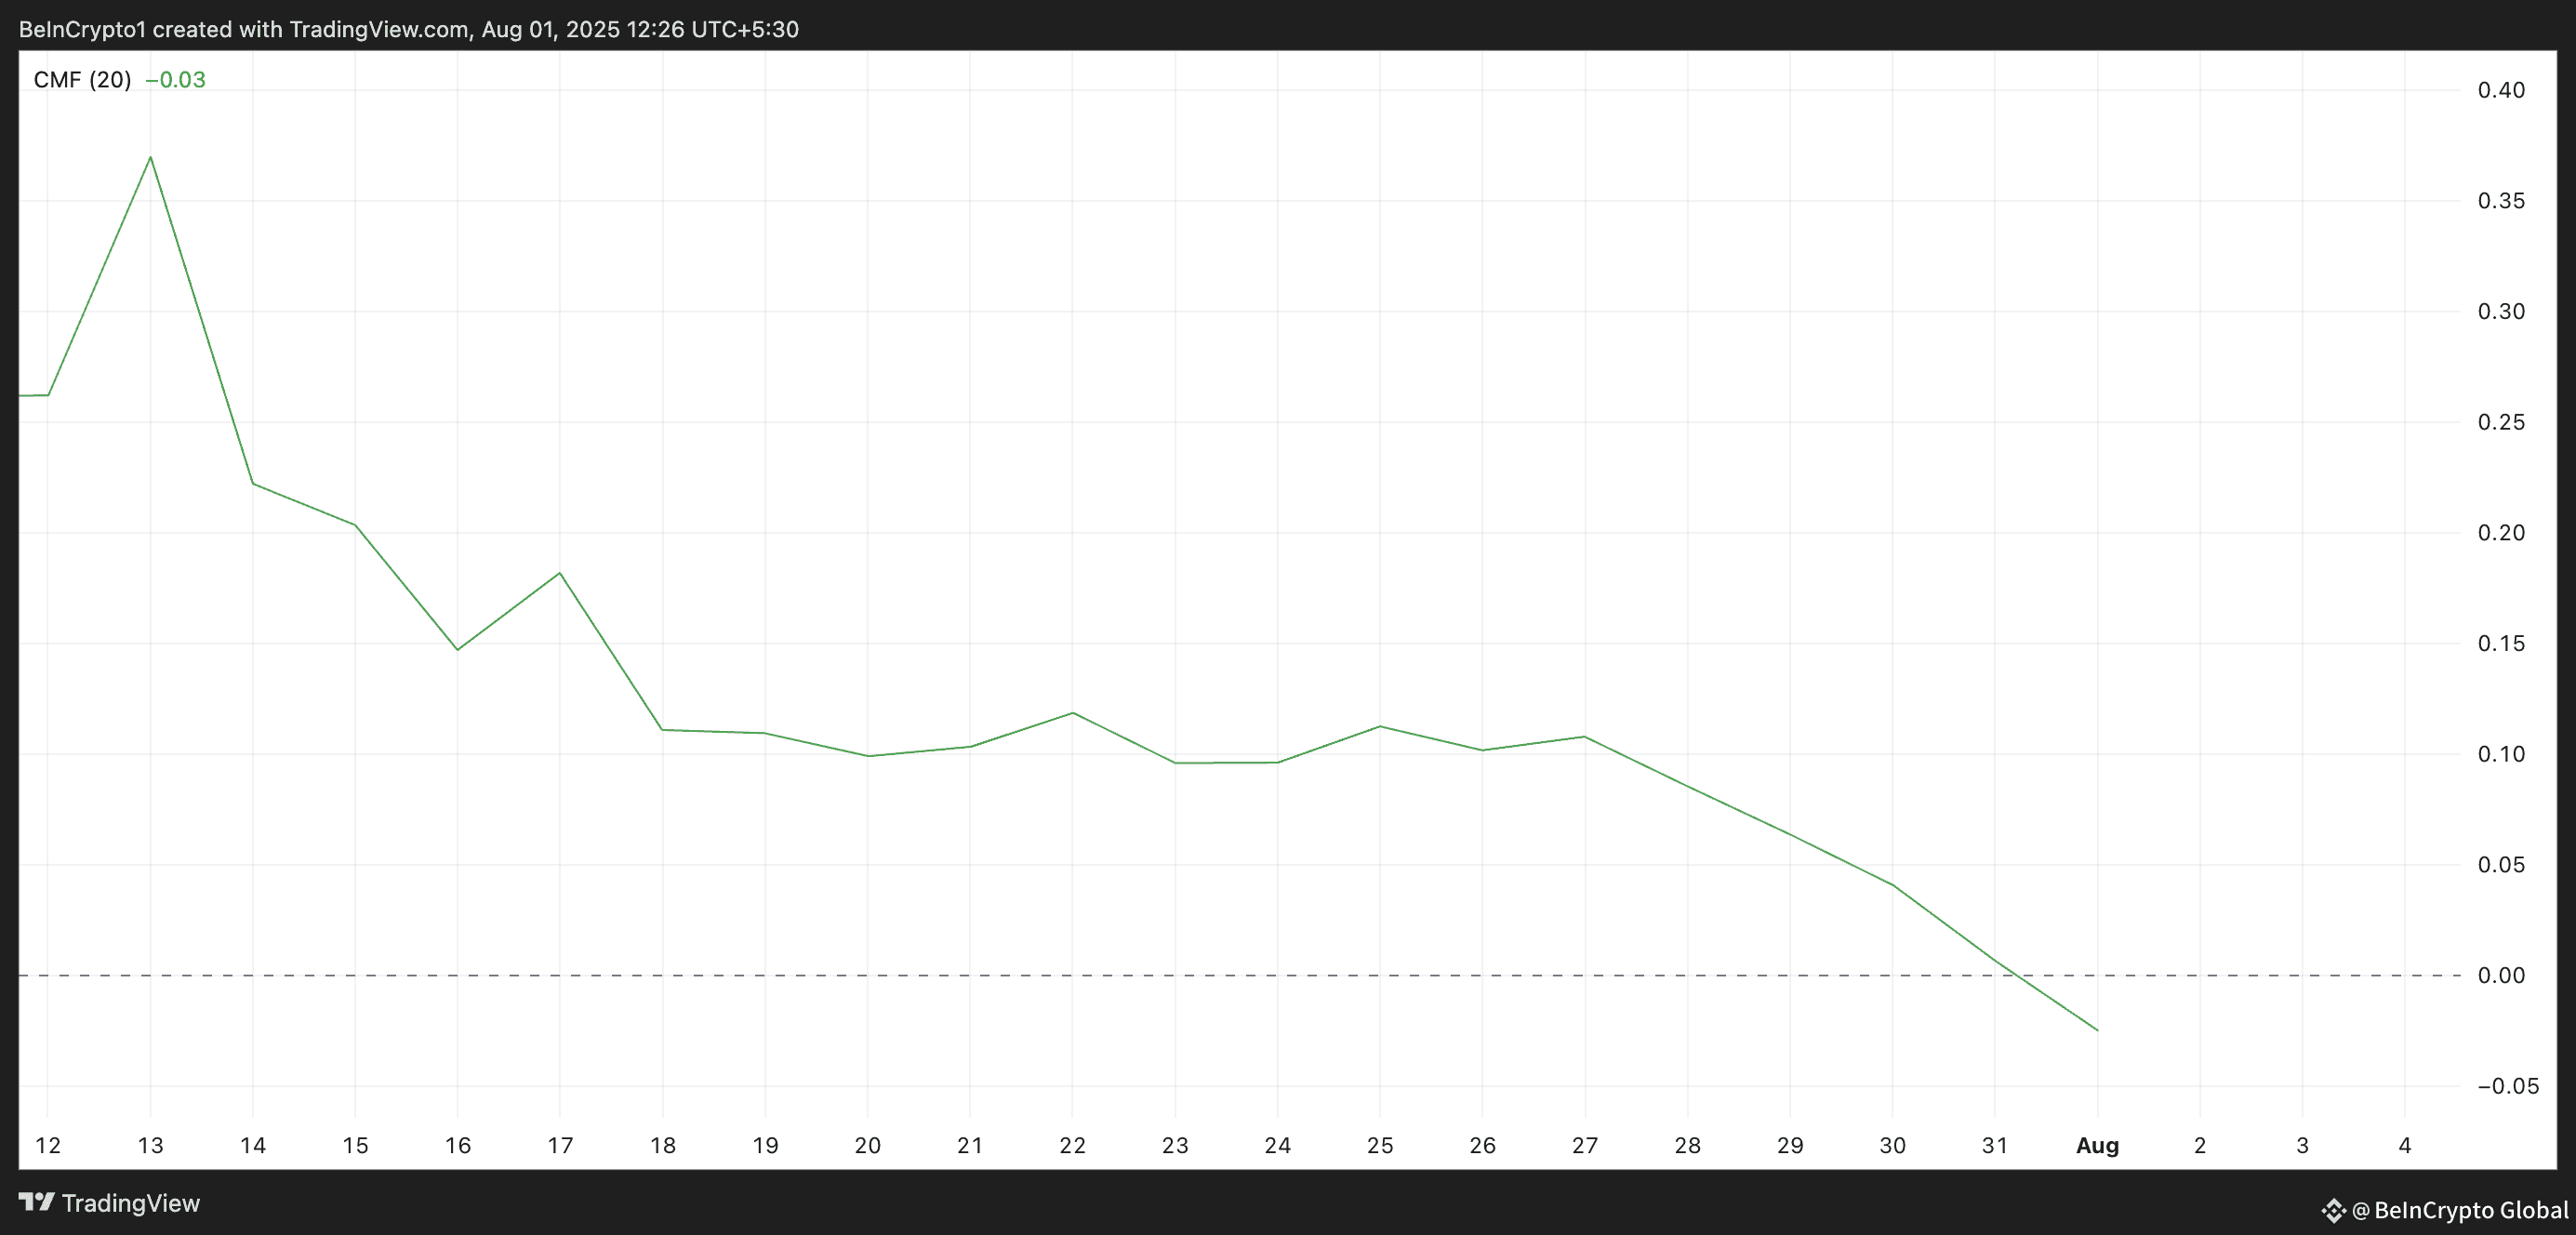 XLM CMF. Source: TradingView
The CMF indicator measures how money flows into and out of an asset’s market. When its value is positive, buyers dominate the market, and capital flows into the asset.
Conversely, a negative CMF reflects distribution—meaning that selling pressure is stronger and money is leaving the asset. This trend suggests that XLM’s ongoing price decline is not merely the result of short-term volatility but is backed by real market weakness.
Will It Break Down to $0.32 or Bounce Above $0.41?
XLM currently trades at $0.39 at press time. The weakening demand for the altcoin and its historically poor August performance suggest it may enter a broader short-term downtrend for another year. With both price momentum and capital flow indicators flashing red, sentiment is tilting firmly in favor of the bears.
If capital inflows continue to weaken, XLM’s price could fall to $0.36. If this level fails to hold, the downtrend may deepen to as low as $0.32.
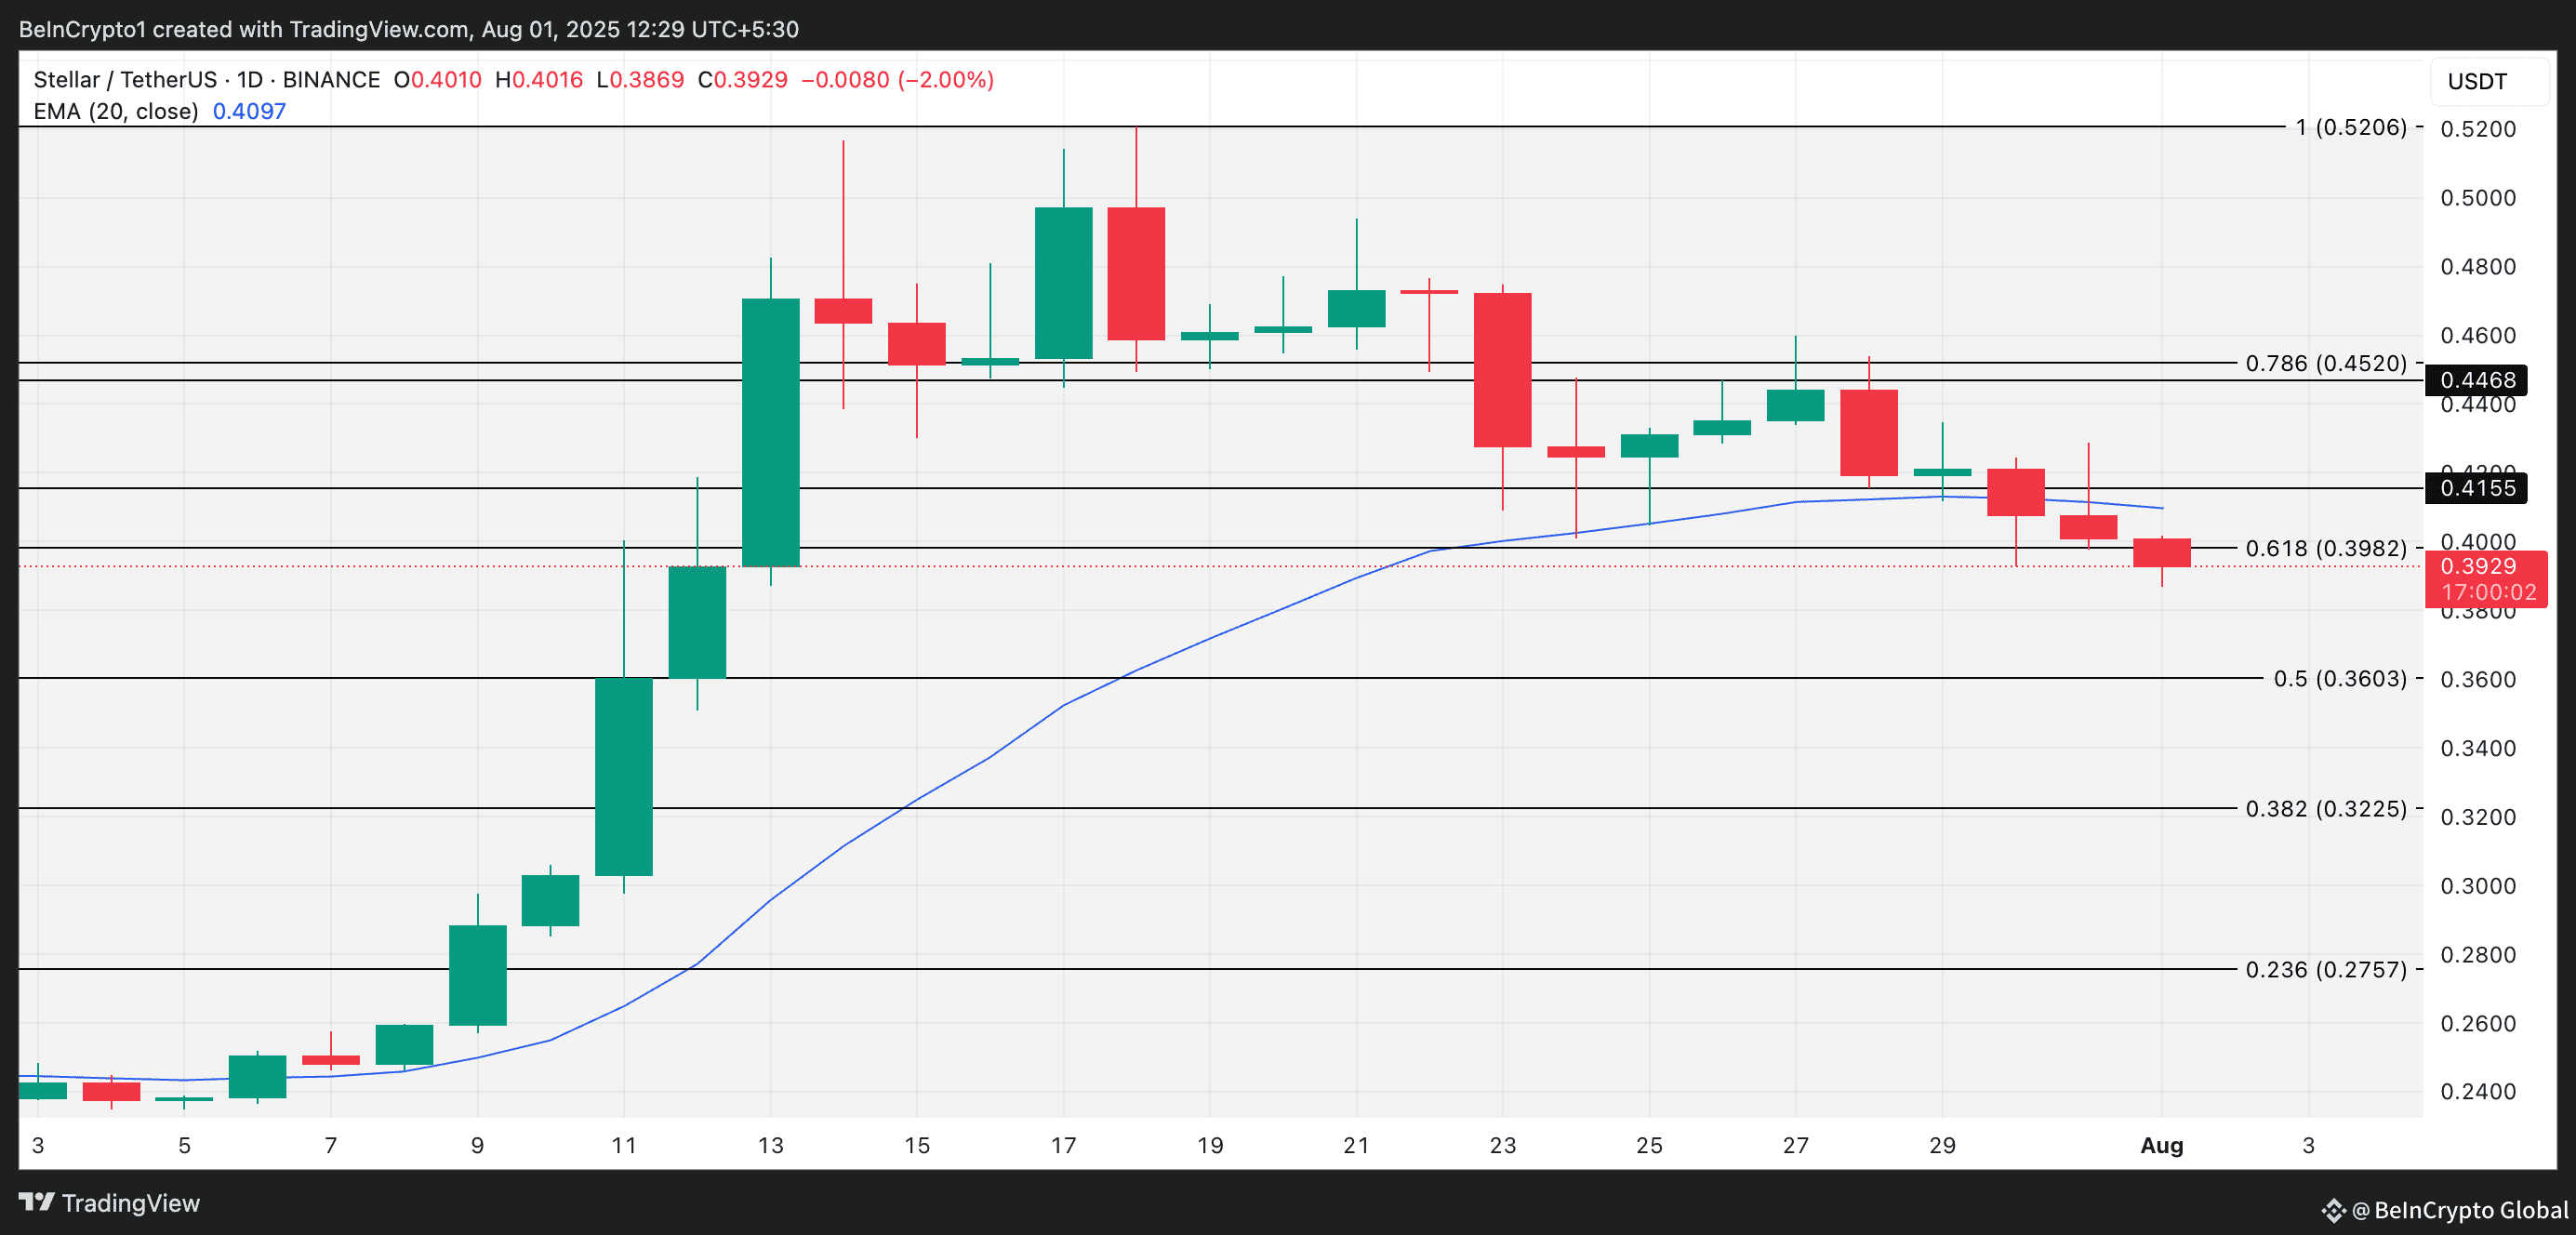 XLM Price Analysis. Source: TradingView
However, a reversal is still possible if buyer demand begins to recover. A sustained uptick in accumulation could push XLM back above its 20-day EMA. If this breakout holds, the token may reclaim $0.41, opening the door to a short-term bullish reversal.
