

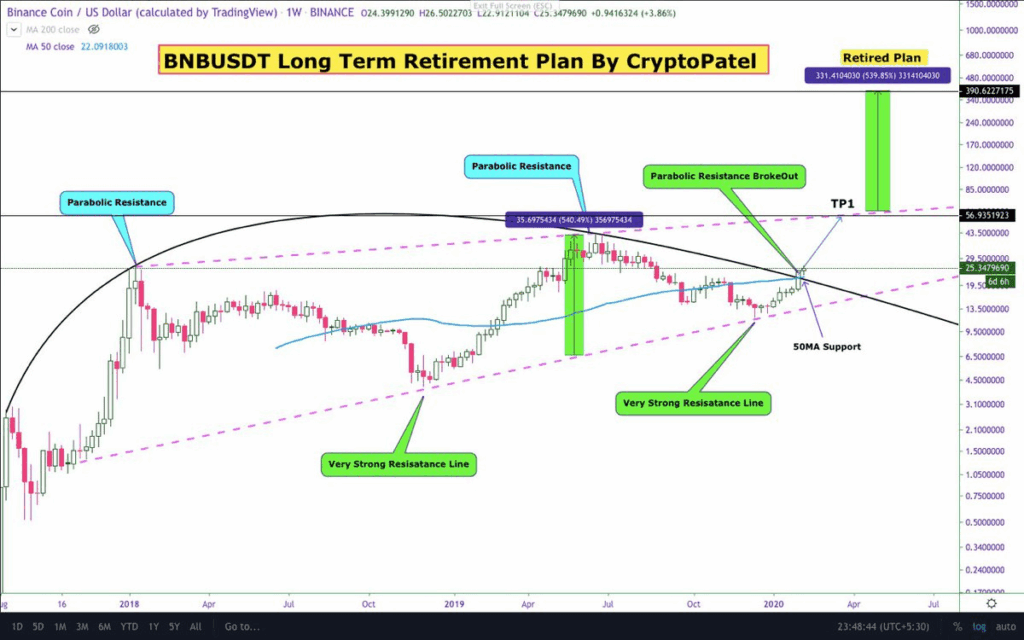
BNB cleared a curved resistance that held for two years and now the price projects toward the $390 zone.
The breakout started near $25 with the chart showing $56 as TP1 and $390 as the long-term possible range.
The move began after BNB bounced off the 50-week moving average and crossed above strong resistance lines.
BNB/USDT has broken through a multi-year parabolic resistance curve, triggering a bullish chart setup for long-term price acceleration. The breakout was detected on the weekly timeframe, with Binance Coin trading at $25.34 during the move. Analysts labeled this chart setup a “Retirement Plan,” anticipating a 540% surge toward the $390 mark.
 Source: X Parabolic Resistance Collapse Sets New Target
The long-standing parabolic resistance that capped gains since late 2017 has been breached. This curved resistance line limited upward movement for over two years. The price action now shows a strong breakout past this key structure.
The chart points to a previous rejection at $39.50, followed by a correction and sideways accumulation. A green candle broke through resistance and continued to hover above it for multiple sessions. This breakout occurred alongside a clear bounce from the 50-week moving average around $22.
Historical data shows a similar pattern in early 2019, when BNB gained over 540% in a few months. At that time, BNB moved from under $7 to nearly $40 in less than 120 days. This surge followed the last time the asset tested a strong resistance zone.
Now, with this parabolic level cleared, the same 540% gain projects a possible target of $390. This is visually confirmed with a labeled green bar pointing toward the “Retired Plan” zone on the chart. The technical formation shows no major overhead resistance until that level.
50-Week Moving Average Provides Clear Base
The 50-week moving average played a crucial role in supporting the bullish setup. During the correction phase, BNB repeatedly tested this moving average near $22. Prices bounced off this level and pushed toward $29.50.
The weekly chart confirms this average as a pivot point for buyers reentering the market. The indicator acted as dynamic support, providing the base for a new upward structure. Holding above this line now suggests strength and continuation potential.
Two diagonal support lines, marked “Very Strong Resistance Lines,” converged near the breakout area. These trendlines created a wedge that compressed price action over several months. Once the price exited this wedge, volume appeared to increase, and price lifted quickly.
This move opens a path toward TP1 marked near $56.93, which stands as the next potential short-term resistance. Beyond that, the chart projection shows a steep curve extending to $390. Traders now question if BNB can reach that retirement target before a pullback sets in.
Resistance Turned Support Could Fuel Long-Term Upside
With the parabolic resistance flipped, this former ceiling may now act as a new floor. That structural shift often boosts buying interest. Support zones created from previous resistance add confidence for continuation moves.
The horizontal level at $29.50 has also become a focus. That level aligns with the last swing high before the breakout. Traders will likely watch this zone closely for confirmation of support if prices retrace.
The long-term trajectory now aligns with a historical pattern that preceded a 500%+ move. If this setup repeats, could BNB fulfill the vision set in the “Retired Plan” zone above $390?
