

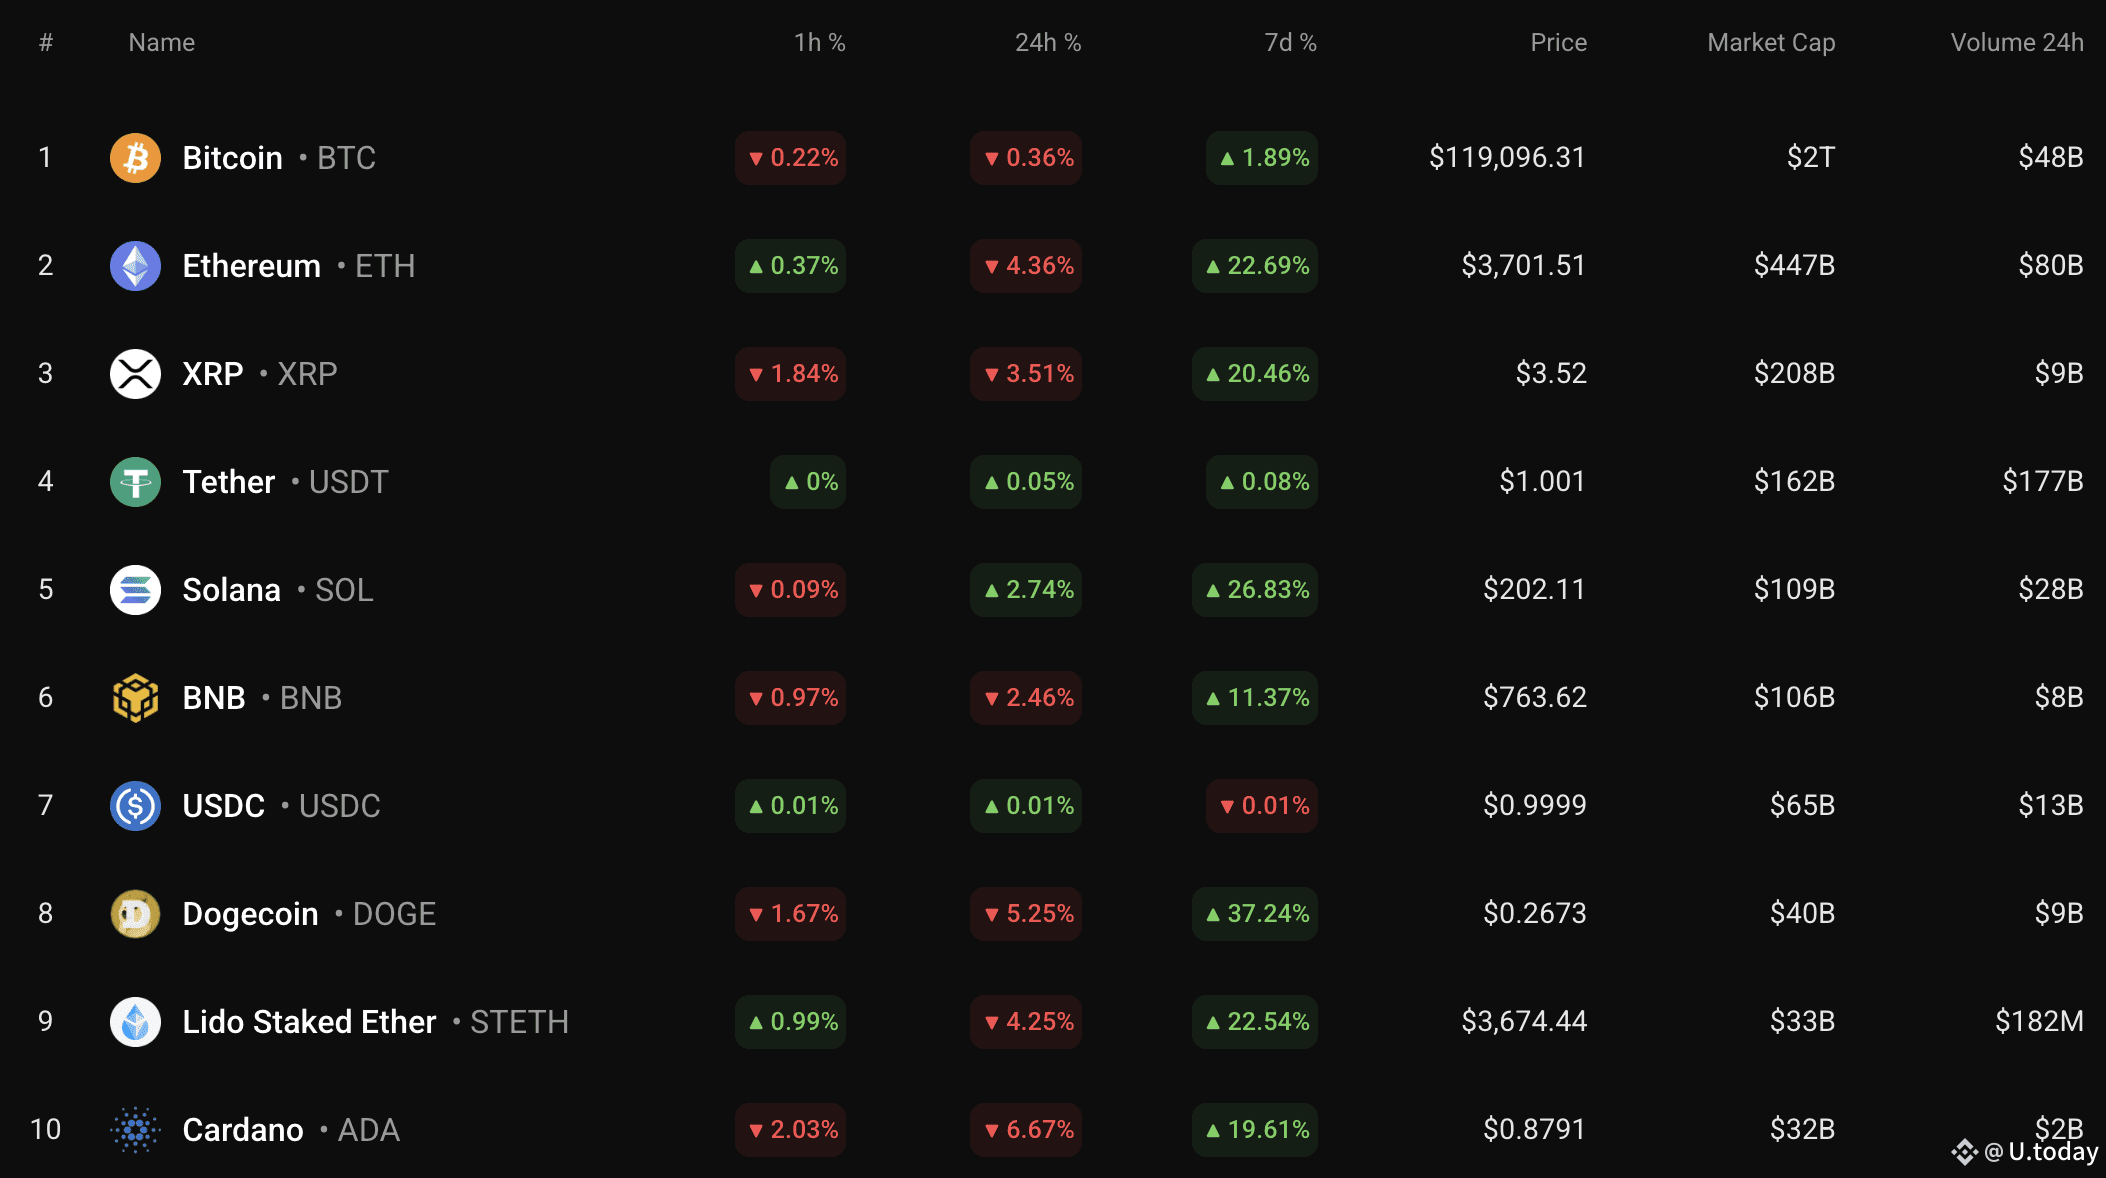
Despite sellers' pressure, some coins remain in the green zone today, according to CoinStats.
 BTC/USD
The price of Bitcoin (BTC) has declined by 0.36% since yesterday.
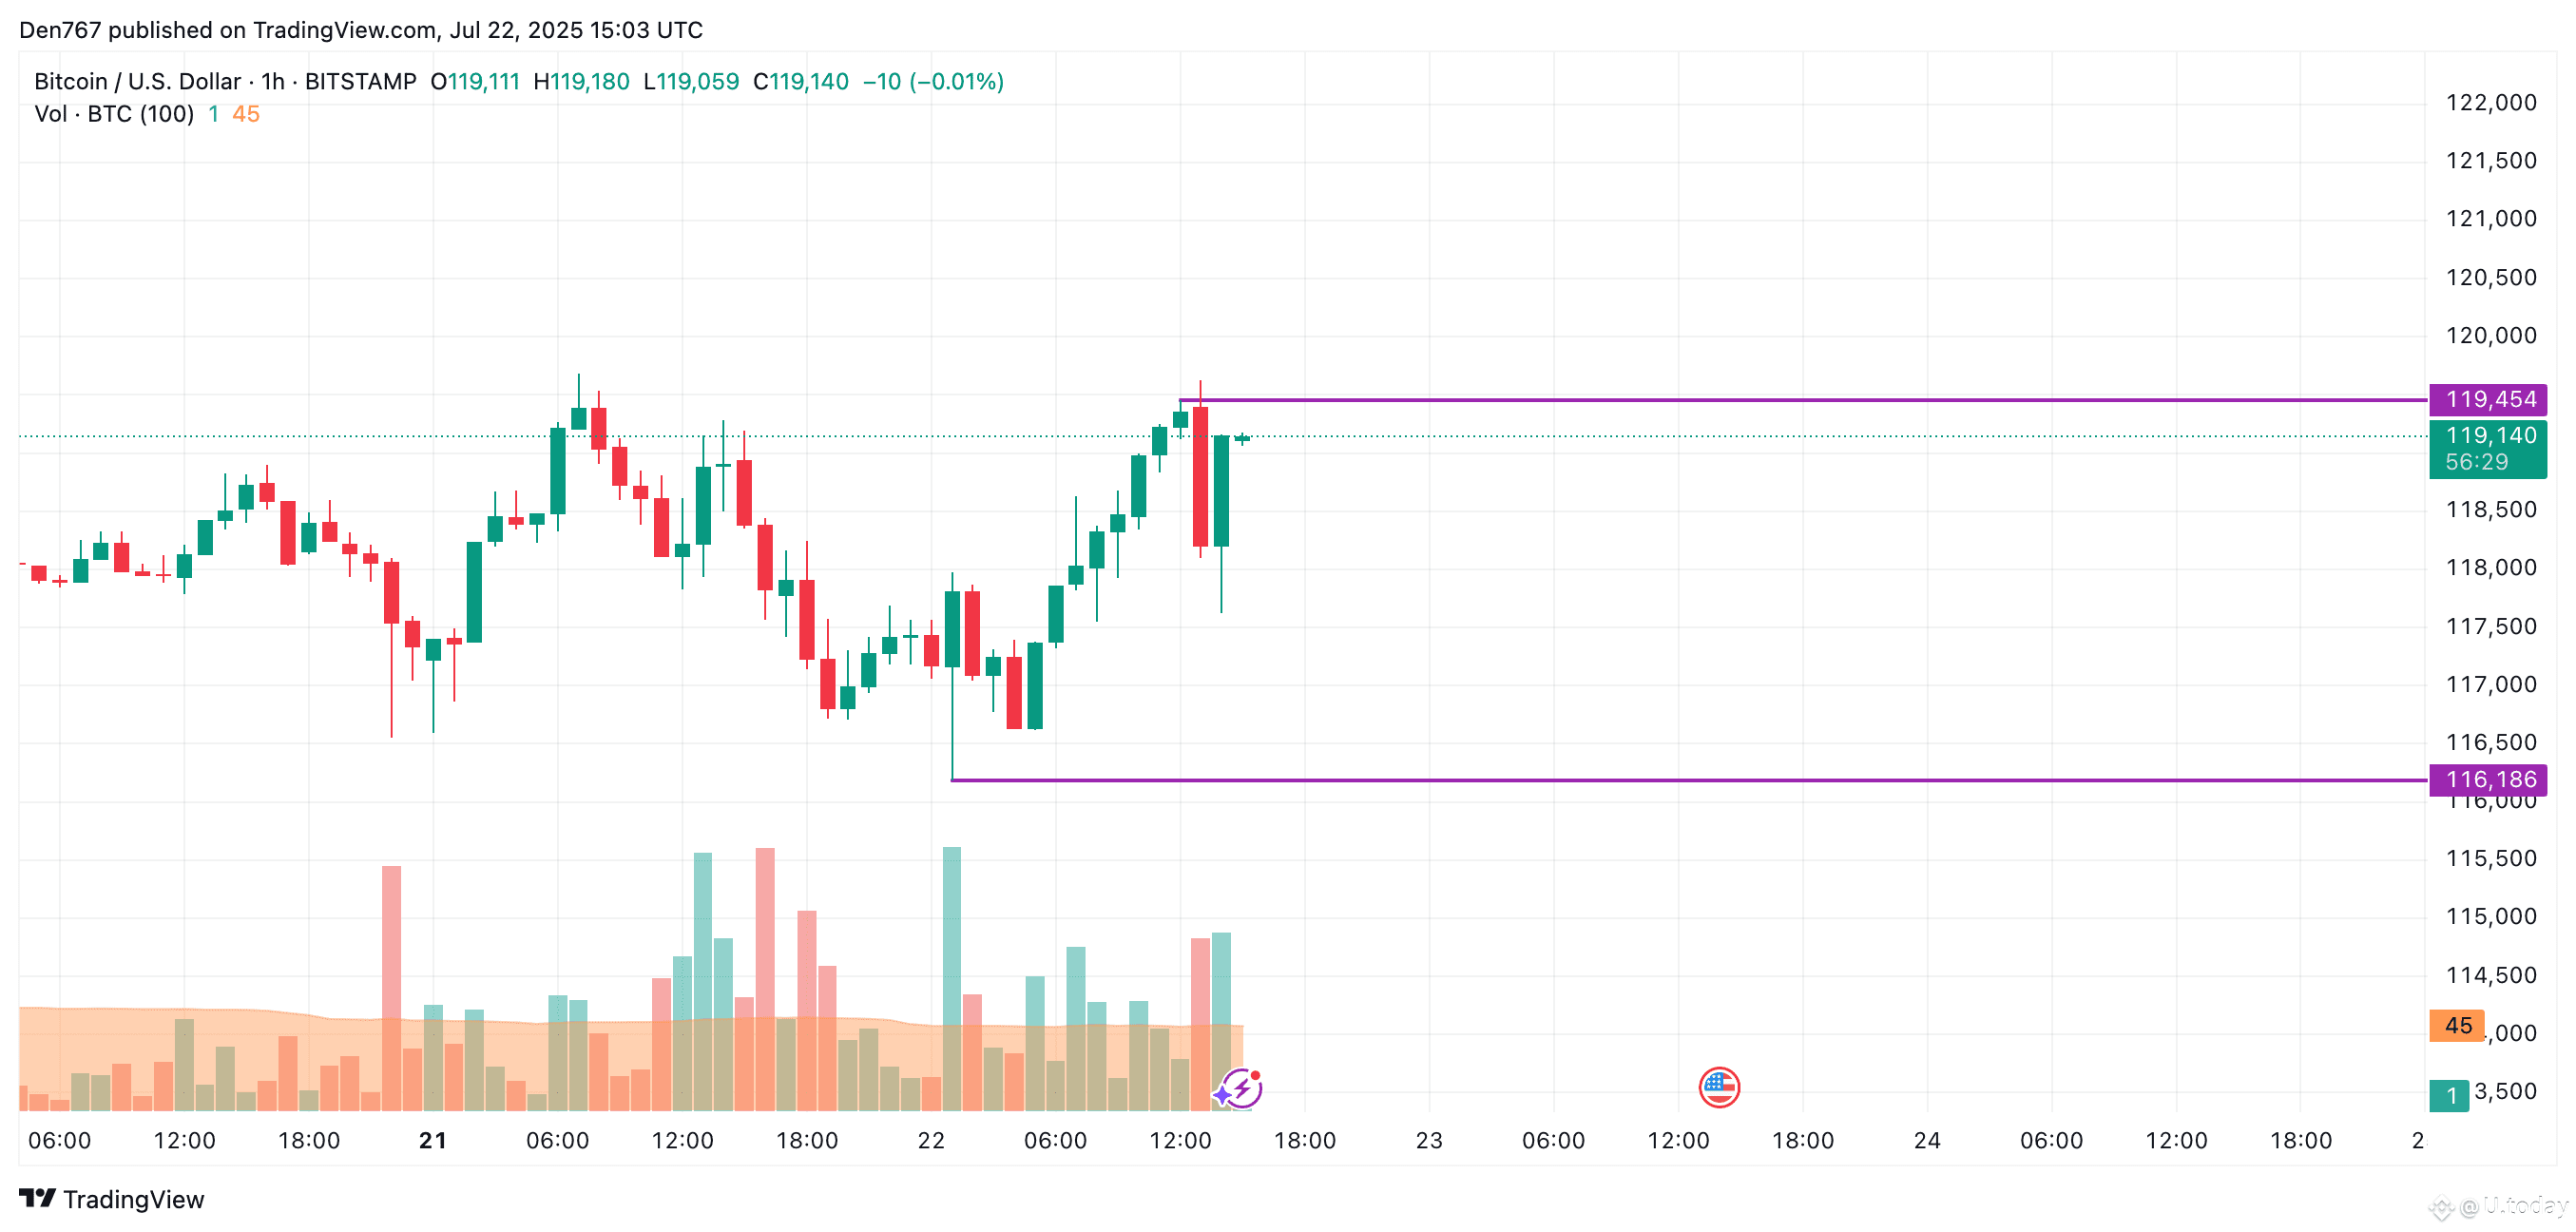
On the hourly chart, the rate of BTC is looking bullish as the price is about to again test the local resistance level. If it breaks out, the accumulated energy might be enough for a test of the $120,000-$121,000 range.
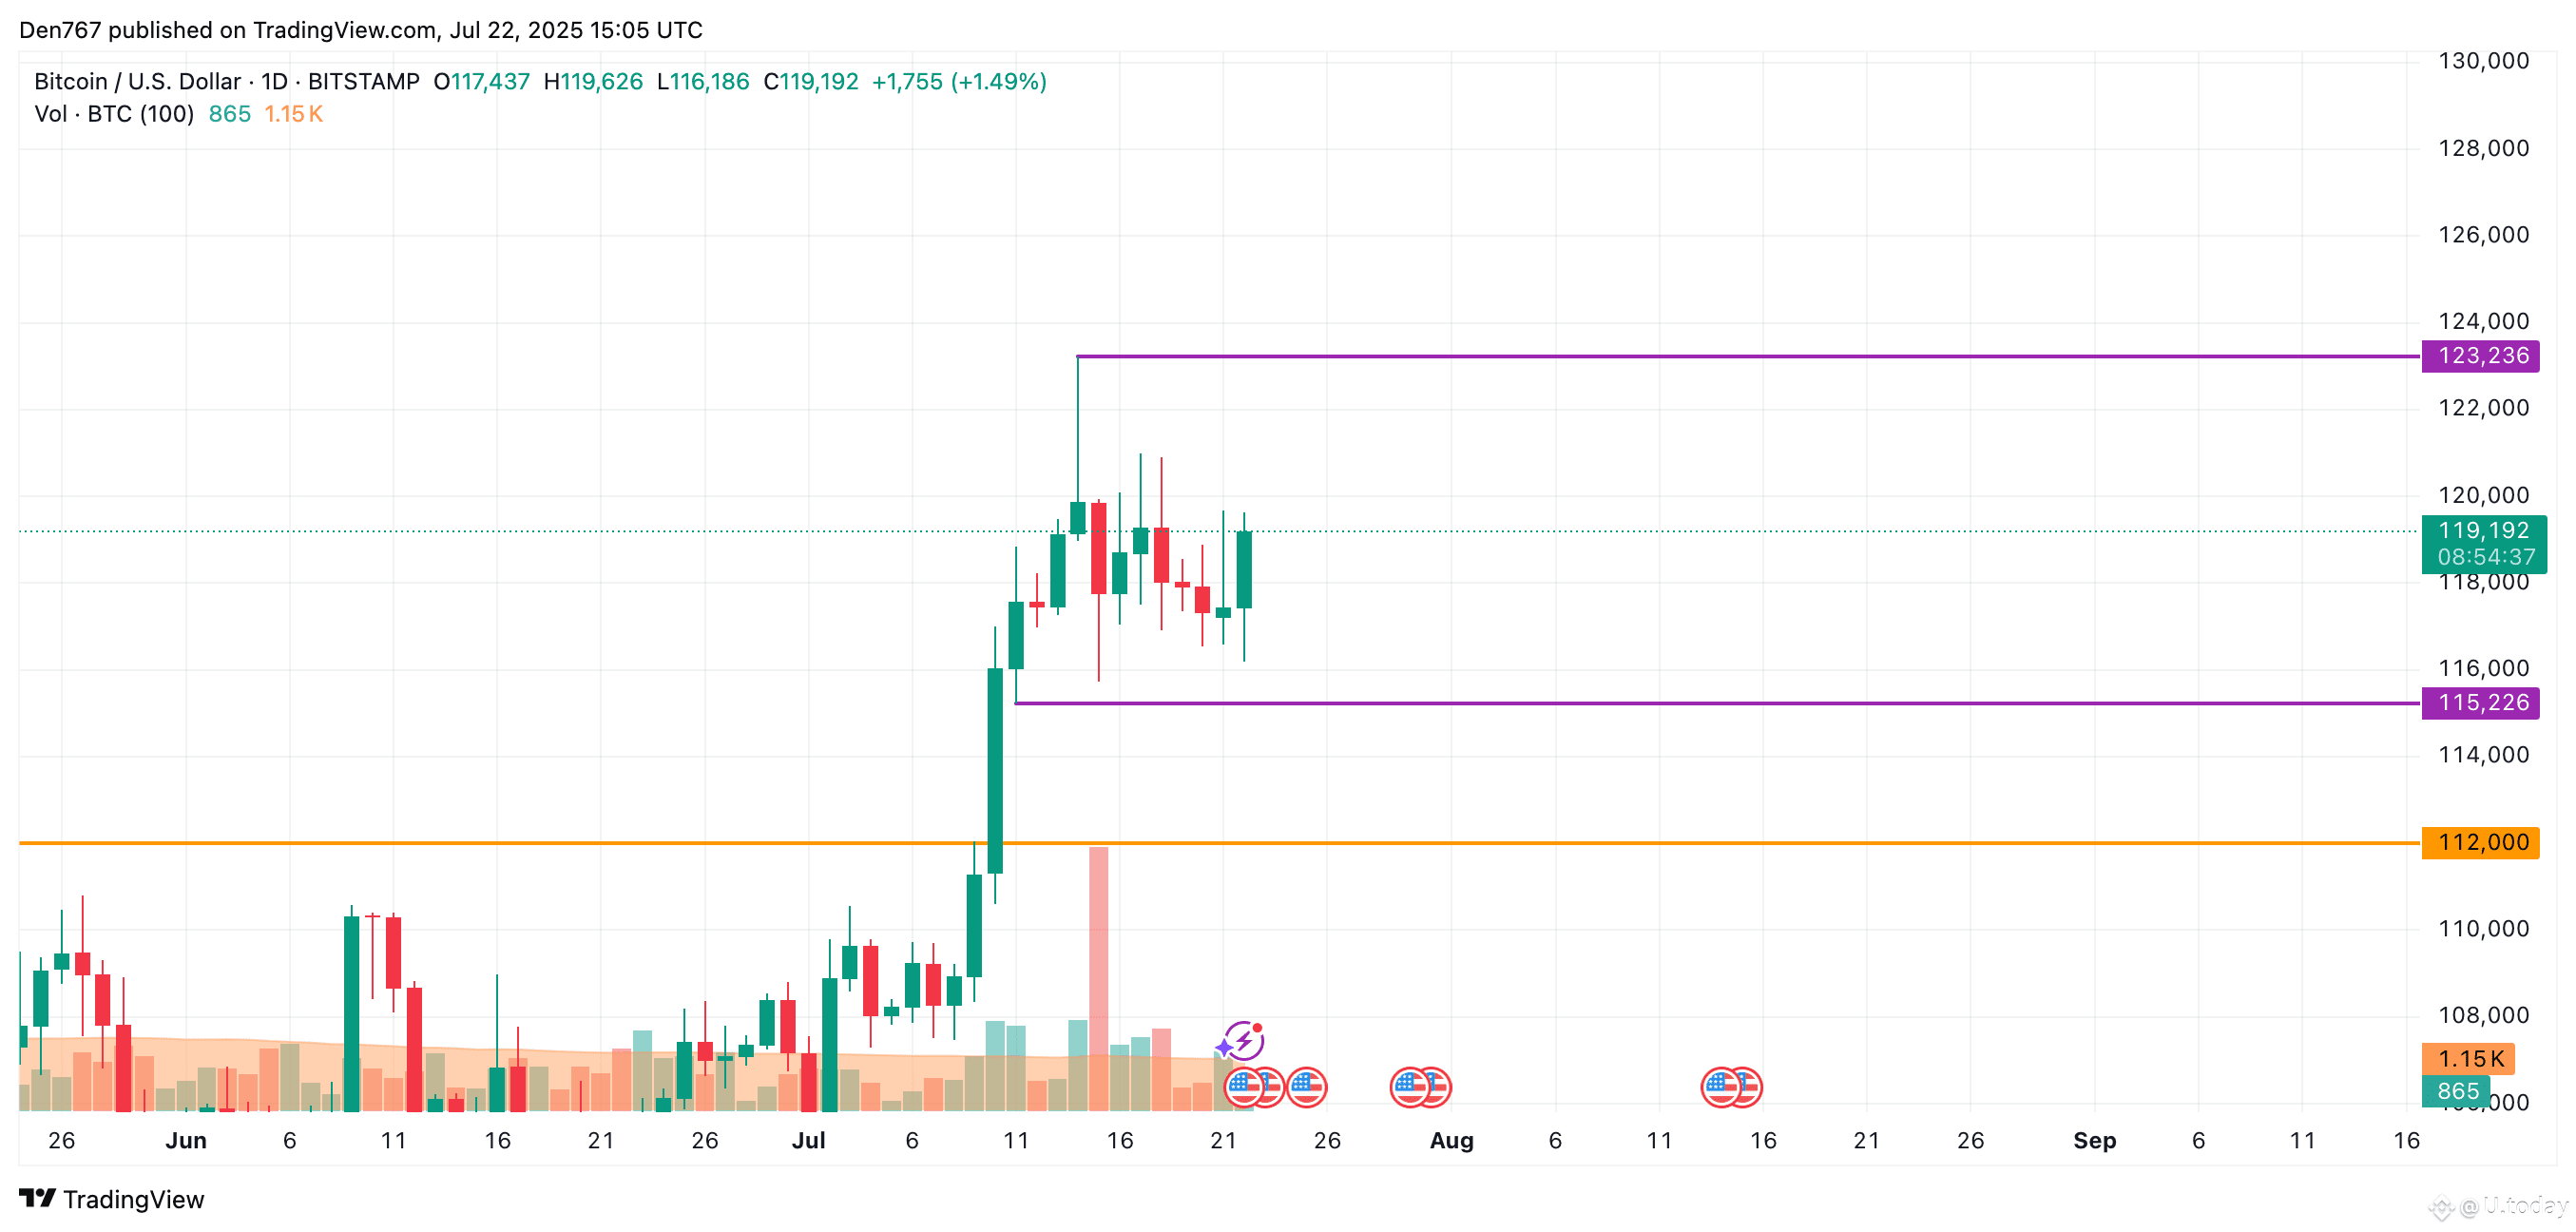
On the daily time frame, the situation is less positive for buyers. The price of the main crypto is in the middle of the wide channel, between the support of $115,226 and the resistance of $123,236.
card
As none of the sides is dominating, ongoing sideways trading in the area of $117,000-$121,000 is the most likely scenario.
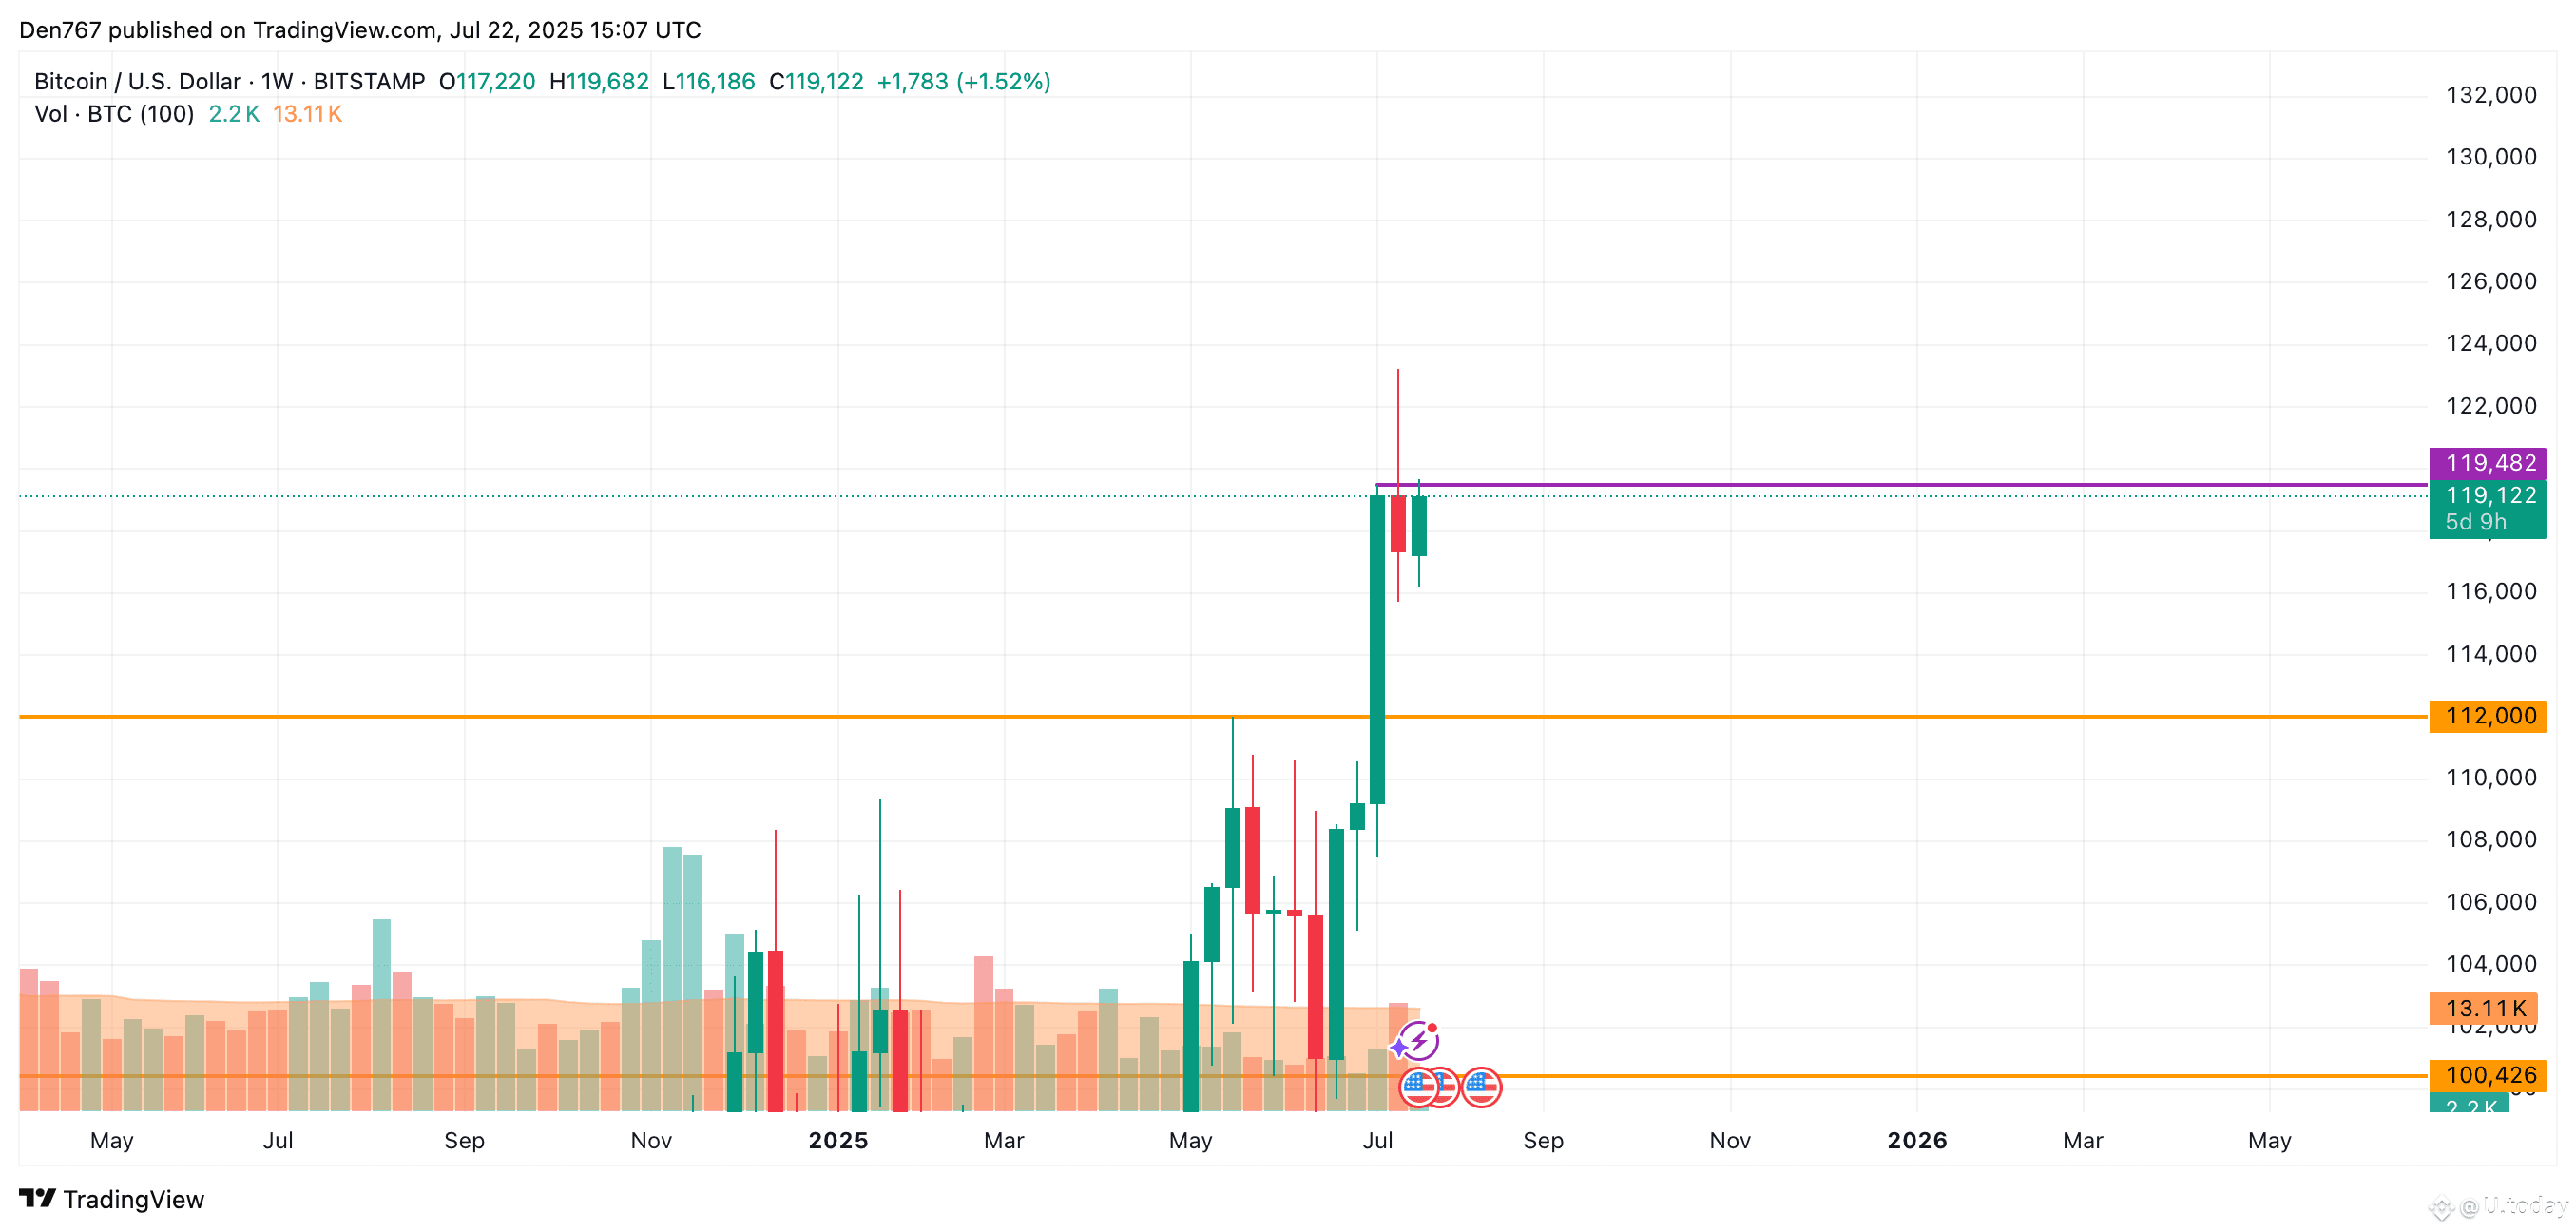
From the midterm point of view, one should focus on the bar's closure in terms of the $119,482 level. If it happens near it or above, growth is likely to continue to a new all-time high.
Bitcoin is trading at $119,122 at press time.


