
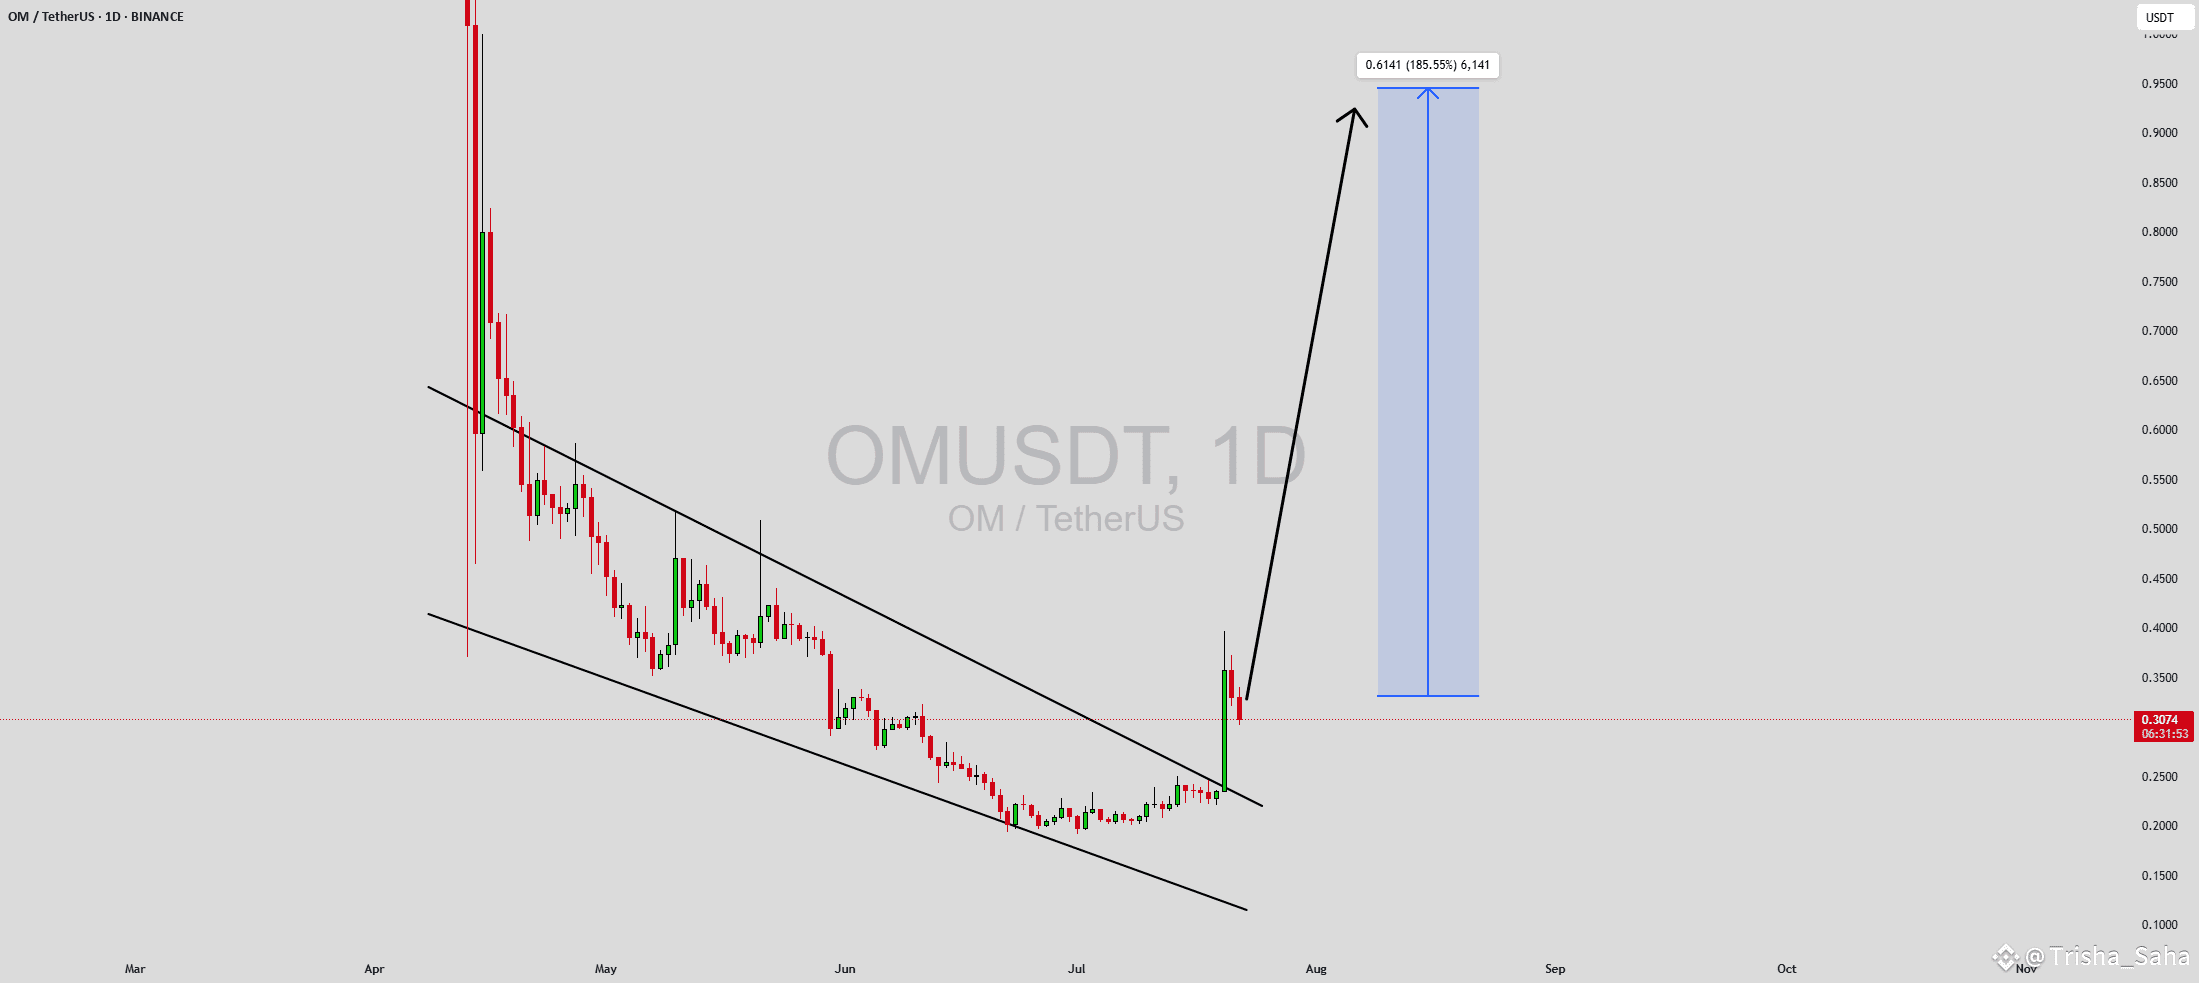
OMUSDT is exhibiting a classic descending channel pattern, often viewed as a bullish reversal signal when accompanied by strong support levels and rising interest. The asset has been consolidating within this downward-sloping channel, and the current price action shows signs of coiling for a potential breakout to the upside. The good trading volume further validates this setup, hinting that accumulation is likely taking place beneath the surface. If the breakout confirms, a powerful move of 140% to 150%+ could be on the horizon.
The OM token, which powers the MANTRA ecosystem, is gaining traction among long-term holders and traders alike. With increasing attention toward decentralized finance and staking infrastructure, OM is benefiting from renewed optimism in this sector. Technical indicators on multiple timeframes align with the bullish scenario, especially if price action continues to respect the support trendline while testing resistance zones.
Traders are eyeing key breakout levels near the upper boundary of the channel, and a close above it could trigger aggressive buying. As this happens, the potential for a parabolic rally becomes significantly more likely. Keep an eye on volume surges and momentum indicators like RSI or MACD to catch early signs of this move materializing.
✅ Show your support by hitting the like button and
✅ Leaving a comment below! (What is You opinion about this Coin)
Your feedback and engagement keep me inspired to share more insightful market analysis with you!
#TrumpBitcoinEmpire #BTCvsETH #ETHBreaks3700 #StablecoinLaw #NFTMarketWatch