
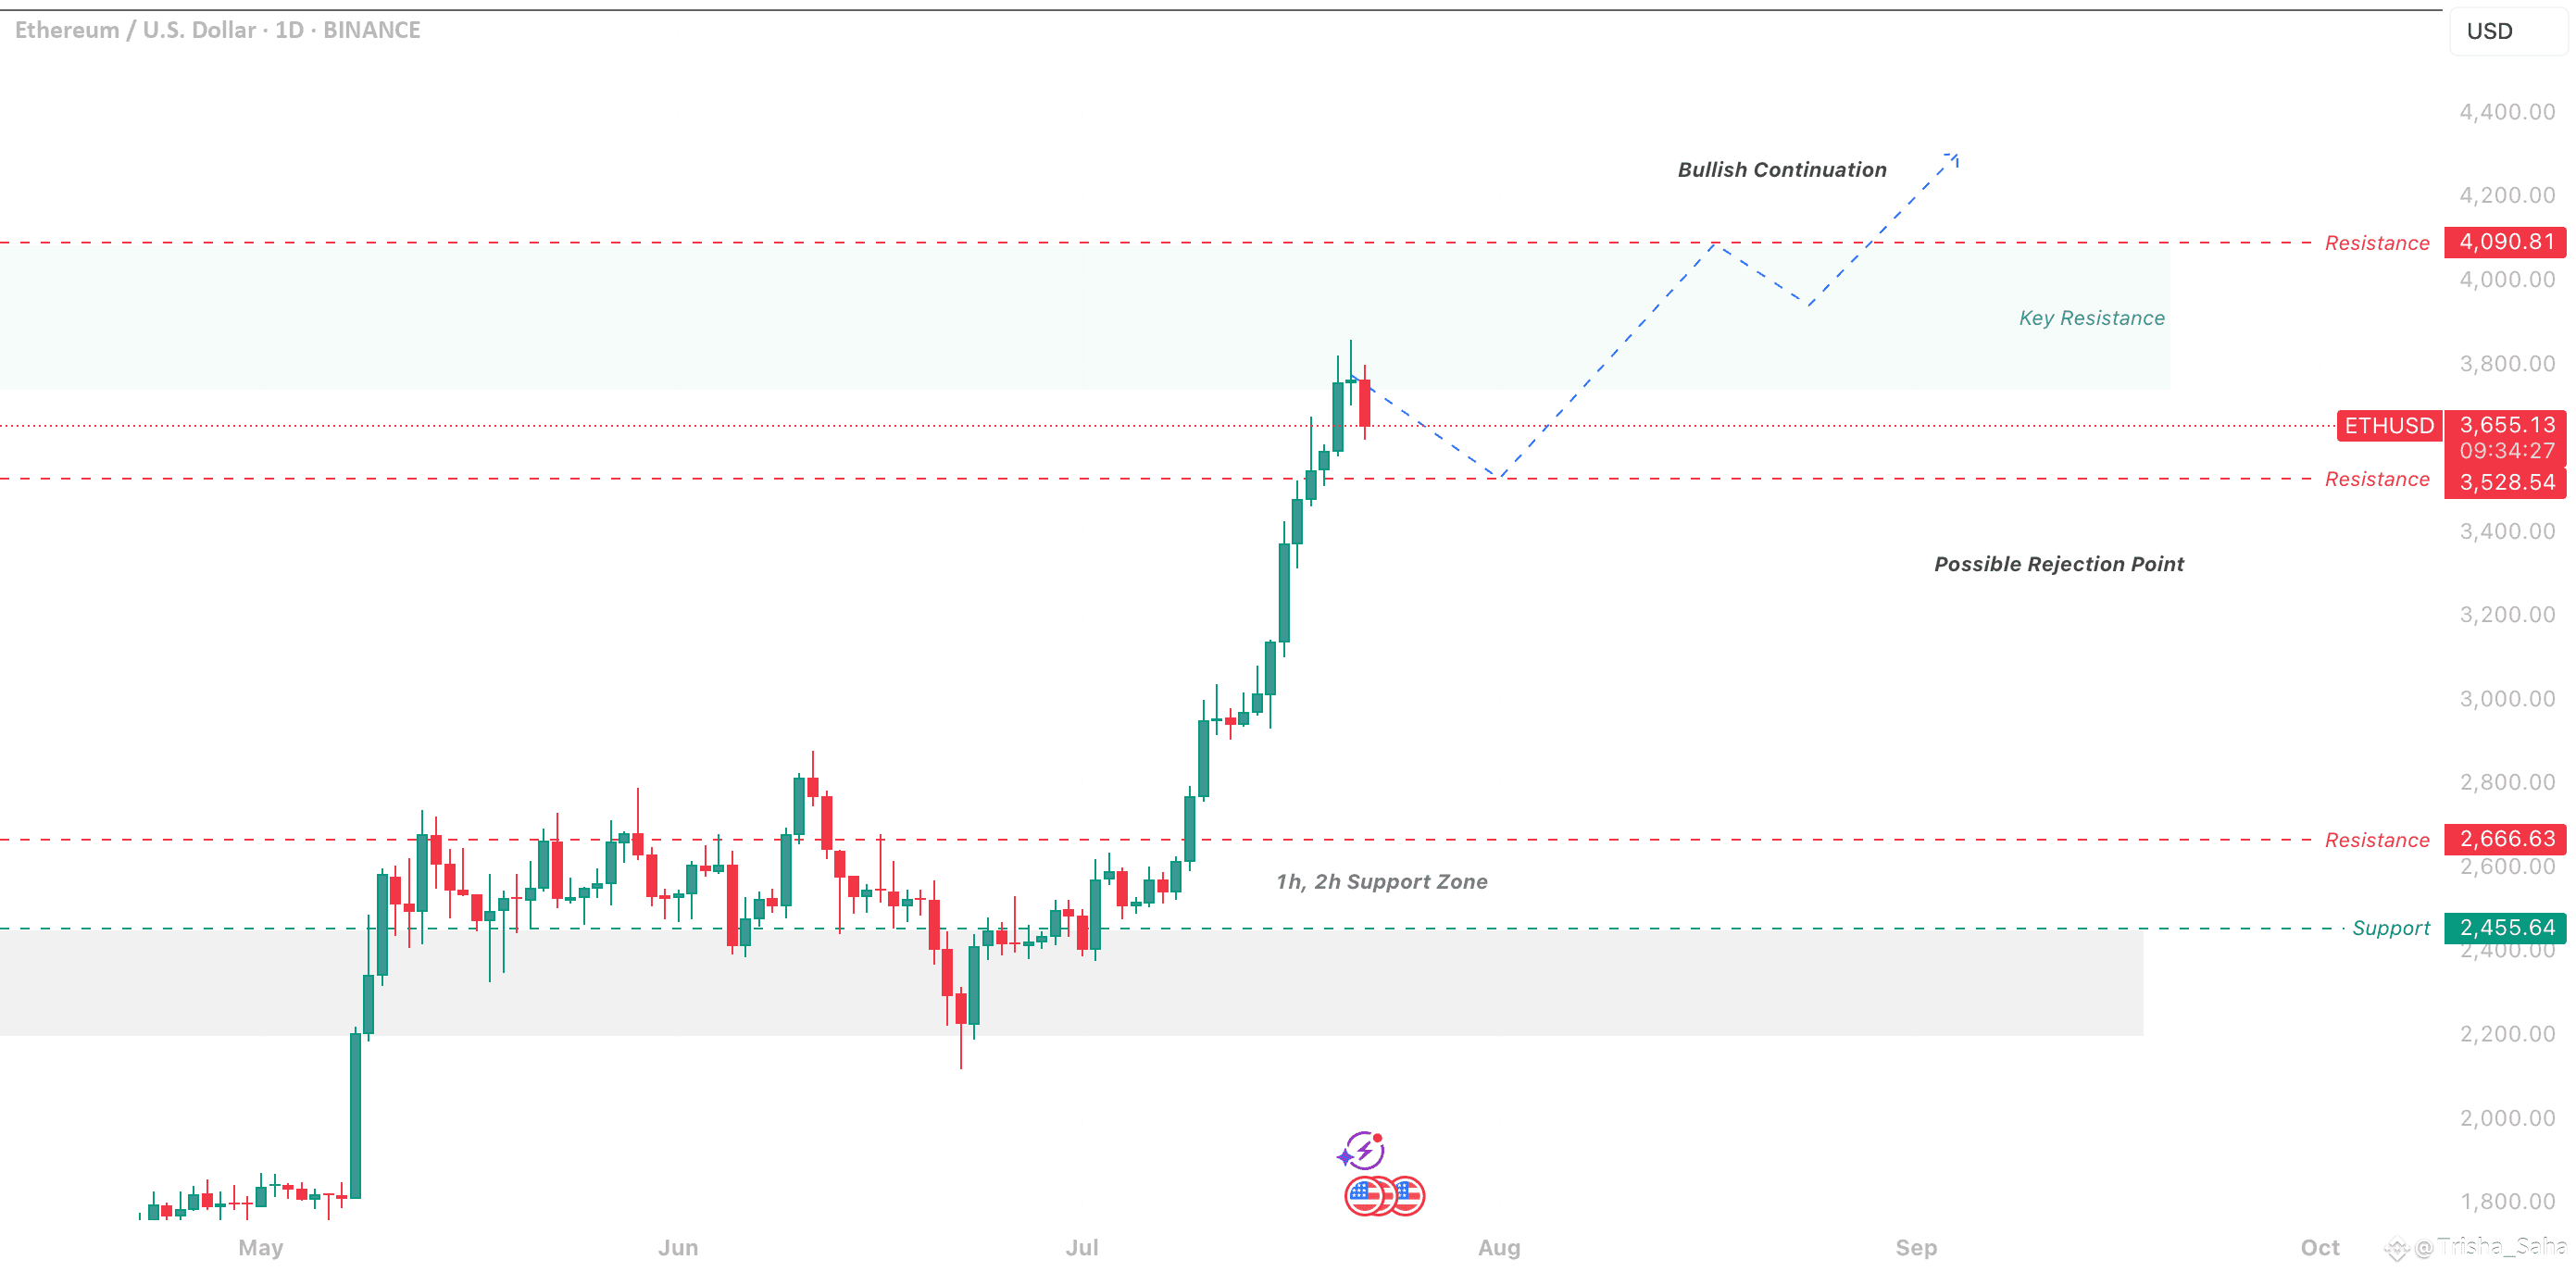
This analysis examines the Ethereum/US Dollar 1-day chart from Binance, focusing on a potential bullish continuation as of July 22, 2025. The chart indicates a recent upward movement following a consolidation phase, with the price approaching a key resistance at $4,090.81. As a reader, I’d want to grasp the context: the 1-hour and 2-hour support zone around $2,455.64 has provided a strong foundation, while the current price action suggests a possible rejection point near $3,600.00 if it fails to break resistance.
My thought process starts with the support zone at $2,455.64, which has historically held, indicating a solid base for any upward move. The price has now reached $3,600.00, a level where it could either break out toward $4,090.81 or face rejection. A successful break above $4,090.81 with increased volume could lead to a continuation toward $4,200.00. However, if the price falls below $3,600.00, it might signal a retreat back to the support zone, invalidating the bullish outlook.
Profit Targets:
Short-term: $4,090.81 (key resistance)
Long-term: $4,200.00 (bullish continuation)
Stop Loss: $2,455.64 (below the 1h/2h support zone)
These targets and stop loss levels provide clarity for managing the trade effectively.
#TrumpBitcoinEmpire #BTCvsETH #ETHBreaks3700 #StablecoinLaw #NFTMarketWatch