
Welcome back to another deep-dive analysis powered by MMC (Mirror Market Concepts), where precision meets market psychology. In today’s BTCUSD setup, we’re observing a textbook confluence of structural breakouts, demand rejections, and liquidity zone engagements. Let’s break it down step by step.
📊 1. Market Context & Background
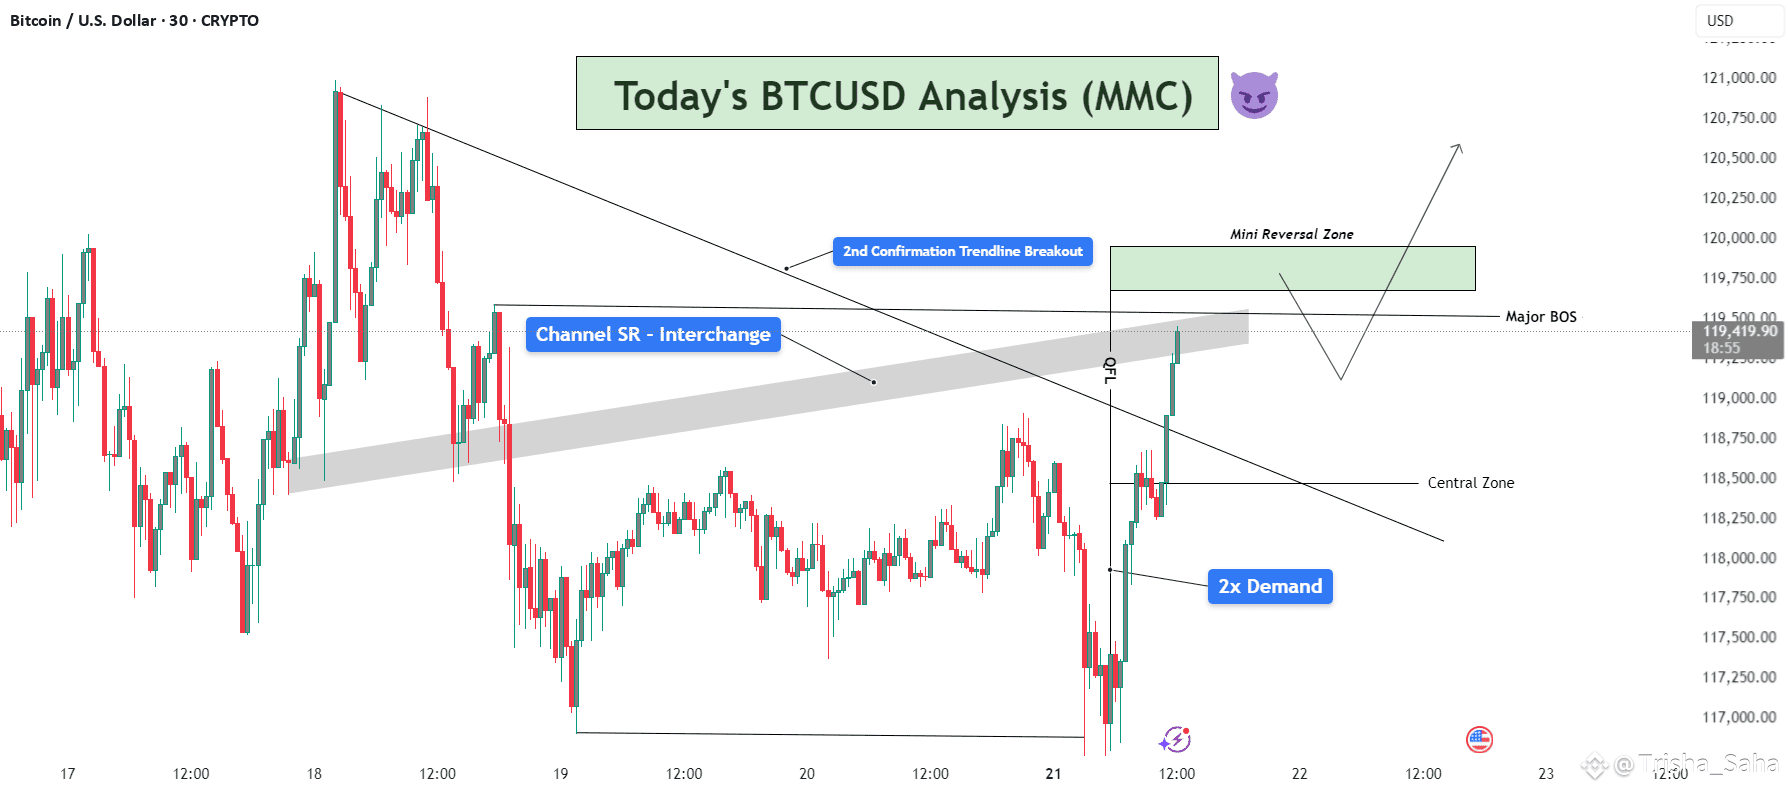
The market recently showed a prolonged bearish trendline structure, with lower highs compressing price into a wedge. The prior days have been consolidative, hinting at an accumulation phase. This forms the foundation for reversal setups we often identify in MMC-style analysis — where liquidity, not just structure, determines the next move.
🔍 2. Demand Zone Dominance – 2x Tap Confirmation
At the bottom of the chart, BTC created a strong 2x Demand Zone (117,250–118,000 area), a region where buyers aggressively stepped in. This zone had already been tested once, and the second tap confirmed demand strength — a key MMC signal.
This dual-tap created a spring effect, launching price upward and rejecting all downside liquidity grabs. It also showed clear absorption of sell-side volume.
📈 3. QFL Behavior + Break of Structure
We see a QFL (Quick Flip Liquidity) reaction just after price bounced from demand — this is a behavior unique to MMC models. Here, price flipped structure rapidly after breaking a local high near 118,500, suggesting aggressive buyer entry.
This QFL event served as the first warning for a major trend shift.
Right after that, we got a major BOS (Break of Structure) above 119,250, further confirming the bullish transition.
🪜 4. Trendline Breakout – Second Confirmation
The descending trendline — connecting several swing highs — was breached with strong bullish momentum. Importantly, this was the second confirmation breakout, not just a fakeout spike.
The breakout candle closed strongly above the trendline and above the SR channel zone (gray area), confirming trend reversal intent.
This aligns with MMC's multi-stage breakout logic, where price gives one trap, pulls back, and then breaks cleanly with intent.
🛡 5. Channel SR Interchange Zone (Support-Resistance Flip)
The gray horizontal SR Channel played a crucial role. Initially acting as resistance, it became support once the breakout was confirmed.
This interchange behavior — a principle where support turns into resistance or vice versa — is critical in MMC. Price flipping this zone and holding above is a strong continuation signal.
🧠 6. Targeting & Forward Outlook
Price is now approaching the Mini Reversal Zone (119,750–120,250). This is a low-timeframe liquidity zone where short-term traders may take profits or where institutional orders may reverse temporarily.
Here are two potential scenarios:
Bullish Continuation: If price pulls back slightly and holds the channel SR as support, we may see a continued leg upward, breaking above 120,250.
Temporary Rejection: A sharp reaction from the Mini Reversal Zone could lead to a retracement into the Central Zone (~118,800), where buyers might reload.
📌 Key MMC Takeaways:
✅ 2x Demand Zone reaction confirmed bullish interest.
✅ QFL + BOS + Trendline Break = High-conviction reversal signal.
✅ SR Flip adds MMC-style structural layering.
✅ Price is now navigating final supply zones before expansion.
👑 Join the Candle King Community
If you find value in these advanced MMC analyses, join the Candle King server — a professional community focused on refining trading journeys through advanced market theory like Mirror Market Concepts, QFL, and real-time price logic.
📢 We don’t just trade levels — we trade behavior.
#BTCvsETH #ETHBreaks3700 #StablecoinLaw #NFTMarketWatch #StrategyBTCPurchase