
📊 BTC/USD 1H Chart Analysis
🔹 Trend Structure:
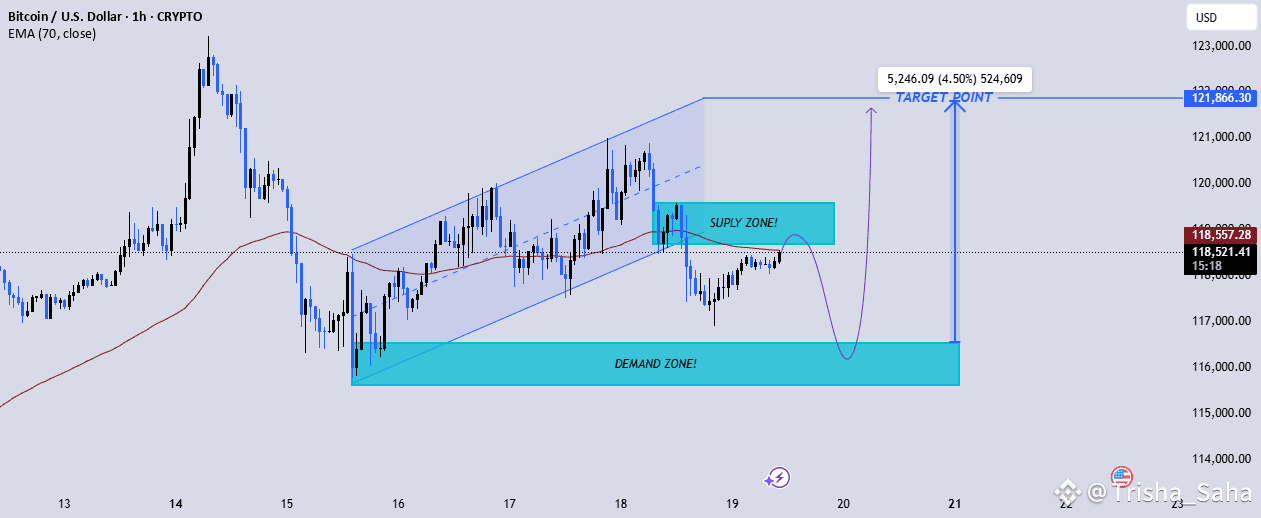
Price broke below the ascending channel, confirming a potential short-term bearish move.
🔹 EMA Strategy:
Price is currently trading below the 70 EMA (118,553), indicating bearish momentum in the short term.
🔹 Supply & Demand Zones:
Supply Zone: 118,800–119,200 🟥 — Price got rejected here after channel breakdown.
Demand Zone: 115,800–116,600 🟦 — Strong potential reversal area marked for long entry.
🔹 Projected Move:
🔻 Expected to dip back into demand zone before reversing.
🔺 Bullish target is 121,866, offering a potential 4.5% gain from demand zone bounce.
🔹 Confluences Used:
✔️ Channel Breakout
✔️ EMA Resistance
✔️ Supply & Demand Zones
✔️ Fibonacci-like retracement potential
✔️ Break & Retest behavior
📌 Plan:
Wait for bullish confirmation in the demand zone, then target 121,866 for a high-probability long setup.
🛑 Risk Management: Use SL below 115,500 for safe exposure.
#CryptoMarket4T #GENIUSAct #BinanceHODLerC #AltcoinBreakout #ETHBreakout3.5k