
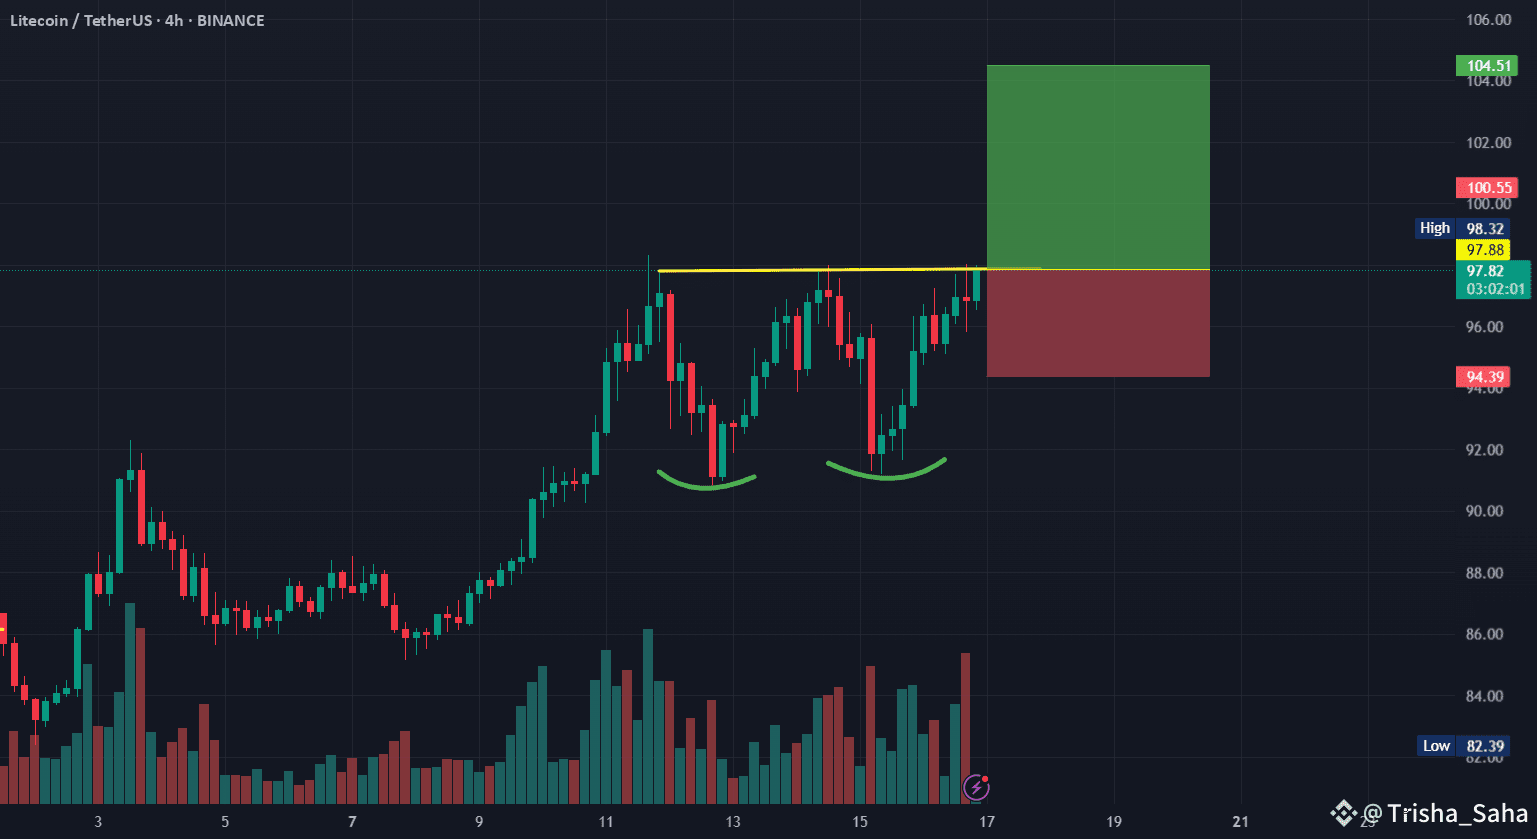
ltc is framing double bottom pattern in the 4h time frame . Lets understand -
A double bottom pattern is a bullish technical analysis pattern that signals a potential reversal of a downtrend. It appears as a "W" shape on a price chart, with two distinct lows (bottoms) at roughly the same price level, separated by a neckline. This pattern suggests that a downtrend is losing momentum and is likely to transition into an uptrend.
Long: $ 98
Stop Loss- $ 94.70
Take Profit : $ 104.51
Take entry after break out and Confirmation.
#BinanceHODLerERA #AltcoinSeasonLoading #BTCWhaleTracker #BTC120kVs125kToday #USCryptoWeek