
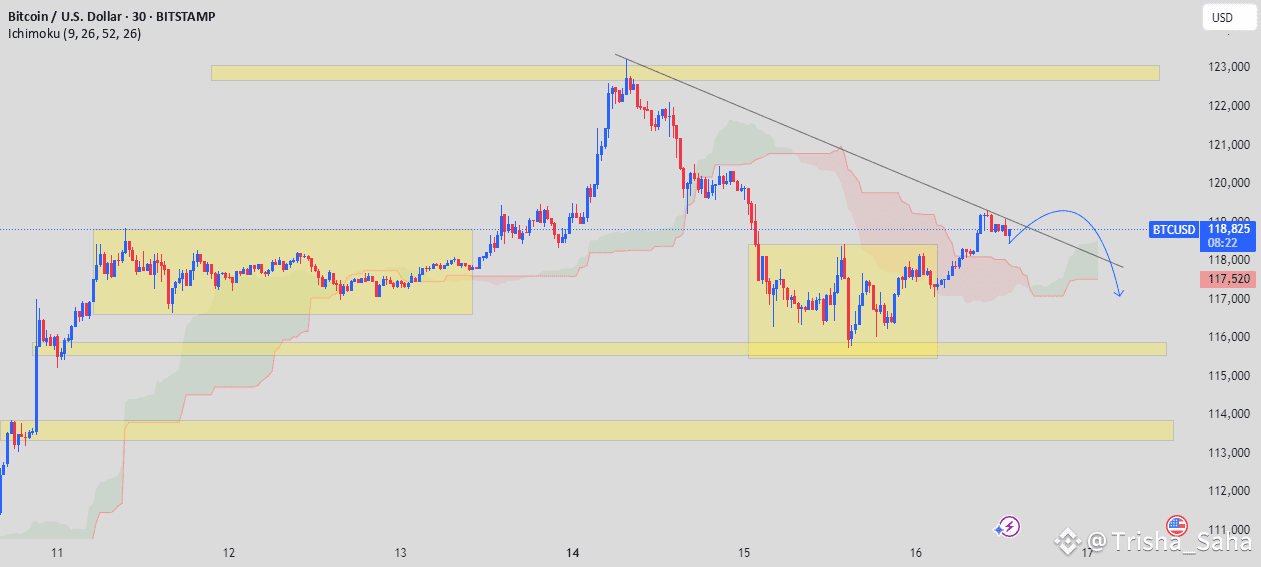
This 30-minute Bitcoin (BTC/USD) chart highlights a critical technical setup where price action is currently testing a descending trendline resistance. The chart utilizes the Ichimoku Cloud to provide insight into support and resistance zones, while yellow shaded areas mark key demand and consolidation zones. After a recent bounce from the $116,000 support region, BTC is attempting to break above the cloud but appears to be facing strong rejection pressure around $119,000. The projected path suggests a potential bearish rejection from the trendline, targeting support near $117,000. Traders should watch for confirmation of a breakdown or a surprise breakout above the descending resistance.
#BinanceHODLerERA #AltcoinSeasonLoading #BTCWhaleTracker #BTC120kVs125kToday #USCryptoWeek