
📊 Market Summary
– Bitcoin trades around $118,009, retreating from its intraday high of $118,330 .
– The recent rally was primarily fueled by $14.8 billion inflows into spot BTC ETFs, lifting BTC to an ATH of $123,000 on July 14
– Profit-taking has triggered a ~3% correction
– Market awaits key CPI/PPI inflation data and regulatory clarity in the US to guide next moves.
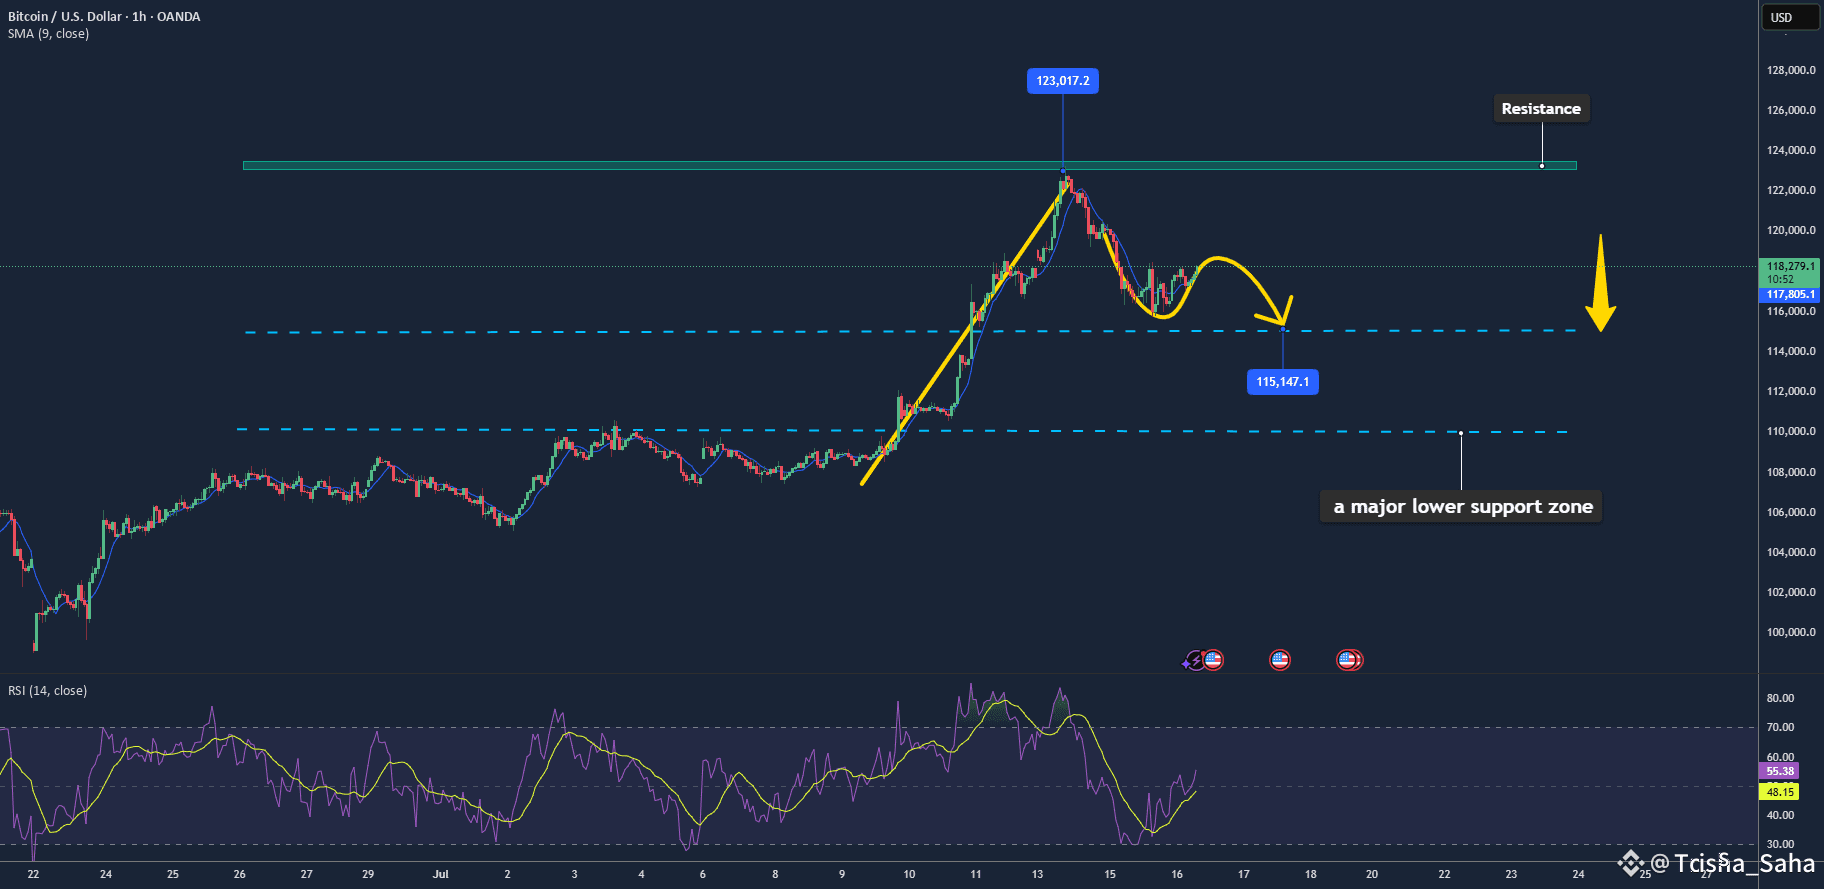
📉 Technical Analysis
• Resistance: $123,000 – $123,100 (all-time high zone, weekly candle top).
• Support: $114,000 – $115,000 (potential retest zone, IH&S neckline, CME gap)
• EMA 9: Price remains above all major EMAs (10/20/50/100/200 day) – bullish short-term trend
• Candles / Volume / Momentum:
• Confirmed inverted head and shoulders breakout above ~$113,000 neckline
• RSI ~74 suggests overbought; short term pullback possible
• MACD bullish but on chain volumes are cooling, reflecting profit taking
📌 Outlook
– Expect a short-term cooldown/pullback toward $114,000–$115,000 for support testing.
– If support holds and ETF inflows continue, BTC could resume rally toward $130,000–$140,000
💡 Trade Strategy
🟣 SELL BTC/USD upon break below $117,000–$118,000 during retrace
🎯 TP: $115,000
❌ SL: $118,500
🟢 BUY BTC/USD at support $114,000–$115,000
🎯 TP: $120,000 – $123,000
❌ SL: $113,000
#CPIWatch #AltcoinSeasonLoading #BTCWhaleTracker #BTC120kVs125kToday #USCryptoWeek