

Bitcoin is showing the same retest pattern for five weeks just like it did in earlier breakout cycles.
Price stayed above the $104400 range line which held firm even after repeated tests this month.
If Bitcoin keeps this weekly close again it may open a path toward $110000 or higher in the near term.
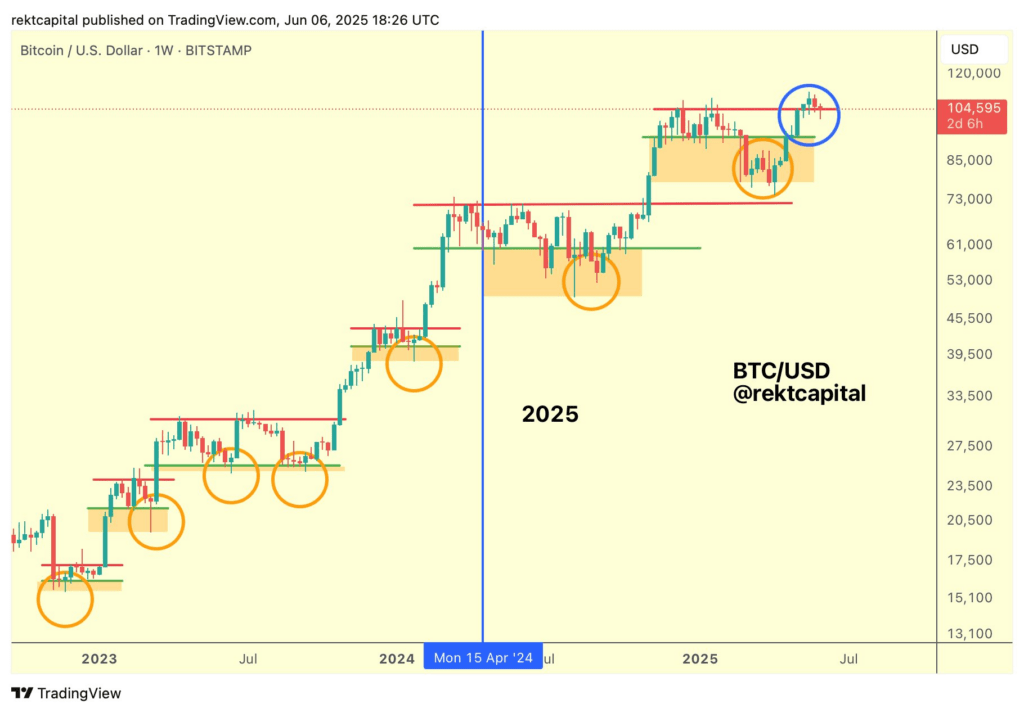
Bitcoin has now closed above the $104,400 range high for four straight weeks and is set to complete a fifth. The weekly chart from Rekt Capital shows a consistent retest of this level, signaling strong price support near current highs. BTC is now trading at $104,595 as the uptrend continues in a structured and historical pattern.
 Source: X
Each retest aligns with previous accumulation and breakout phases dating back to 2023 and 2024. Orange circles mark similar patterns where Bitcoin confirmed support, followed by upward continuation. The weekly closes above resistance zones have historically indicated early stages of further rallies.
The latest chart highlights a repeating trend where Bitcoin uses previous highs as support zones before pushing to new levels. If BTC holds above $104,400 this week, it would mark the fifth consecutive successful retest, boosting confidence in the ongoing cycle.
Weekly Retests Mirror Previous Cycles
Bitcoin has repeatedly used past resistance zones as fresh foundations for upward movement. From 2023 to 2025, the chart shows five key retests that turned former ceilings into confirmed support. Each setup follows a similar path: a range breakout, a consolidation pullback, and a bullish weekly close.
The current cycle began after BTC broke through $85,000 earlier in 2025. It briefly pulled back to retest the $85,000–$88,000 range, marked in orange on the chart. After holding the level, BTC surged toward the $104,400 zone and has remained near this high for several weeks.
The historical structure of weekly support holding steady increases the likelihood of bullish continuation. The red resistance line near $104,400 now serves as a key level for market participants. Continued strength at this price could open new targets above $110,000 if volume sustains momentum.
Range High at $104,400 Now Key for Weekly Price Action
As of June 6, Bitcoin trades just above the $104,400 range high, with the fifth weekly candle forming close to this level. The red horizontal line in the chart marks this significant threshold, which has already been tested four times since early May. Each close above this line signals market acceptance of a higher valuation.
The visual setup from Rekt Capital places the current structure in line with 2023 and 2024 retests, all of which preceded sustained rallies. The blue circle on the chart identifies the present pattern, which looks to match earlier consolidation zones followed by major moves. A fifth close above $104,400 would add further weight to this outlook.
Bitcoin is now trading at $104,595 with two days left for the weekly close. This price behavior, if maintained, would continue the bullish structure that has played out multiple times over the past two years. The pattern of retesting and holding higher ranges could offer a reliable signal for the next breakout.
Will Bitcoin Maintain Its Weekly Strength and Confirm a New Bullish Leg?
Bitcoin’s ability to hold the $104,400 level for a fifth week may be key to confirming this cycle's next upward push. As historical retests often led to rallies, the current zone may define the short-term trend. Will BTC confirm this setup with another strong weekly close, or will selling pressure emerge near this critical level?
