
Coin Name: $BCH
Position: LONG
Entry Price: 406.00
On the lower time frame, BCH appears to be forming a falling wedge pattern, which is typically a bullish setup. The RSI is holding near the supply zone, indicating potential strength. If BCH pulls back to the lower trendline of the wedge and successfully holds it as support, there's a strong possibility of an upside breakout.

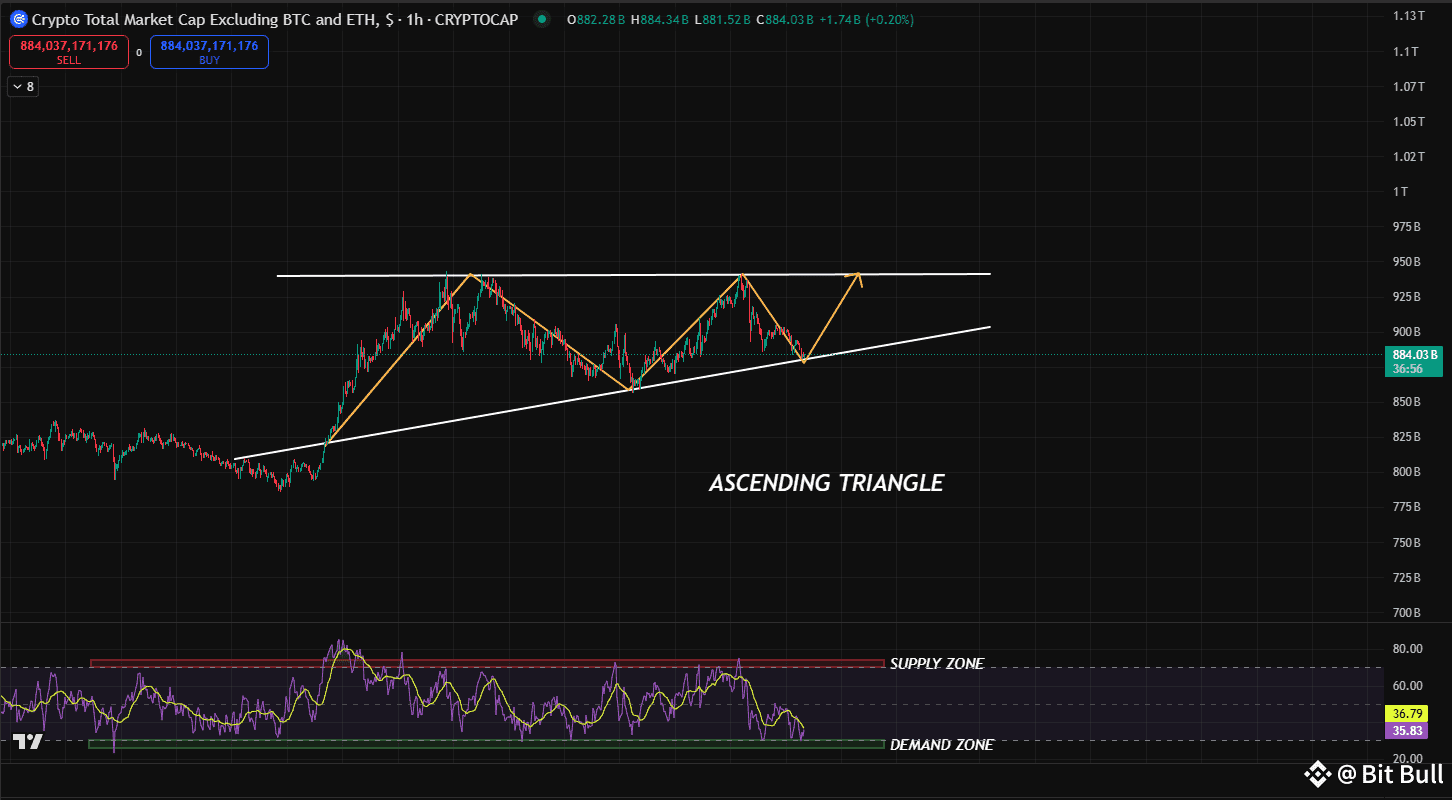
On the 1-hour timeframe, TOTAL3 is also forming an ascending triangle pattern, which is generally a bullish formation. The RSI is currently holding in the demand zone—an area often associated with strong buying interest—indicating potential for upward continuation if momentum builds.
On the 12-minute time frame, there's significant liquidity on both sides of BCH. It’s likely that BCH will first move lower to sweep the downside liquidity before reversing to target the liquidity resting above.

LEVERAGE: 5X
Targets:
1st TP 413
2nd TP 420
3rd TP 430
For daily new signals like this, by following these simple steps:
Click my Binance LIVE for more information and signals update
$BCH