
Coin Name: $BTC
Position: Short
Entry Price: 112,450
On the 12-hour chart, Bitcoin is forming a rising wedge, a bearish pattern suggesting a potential drop toward \$95,000 if it breaks down. The RSI is holding within a supply zone, adding to the bearish bias. A short position can be considered either from the upper trendline or after a confirmed breakdown. Use a 1:2 or 1:3 risk-reward ratio, based on your personal risk tolerance and trade strategy.

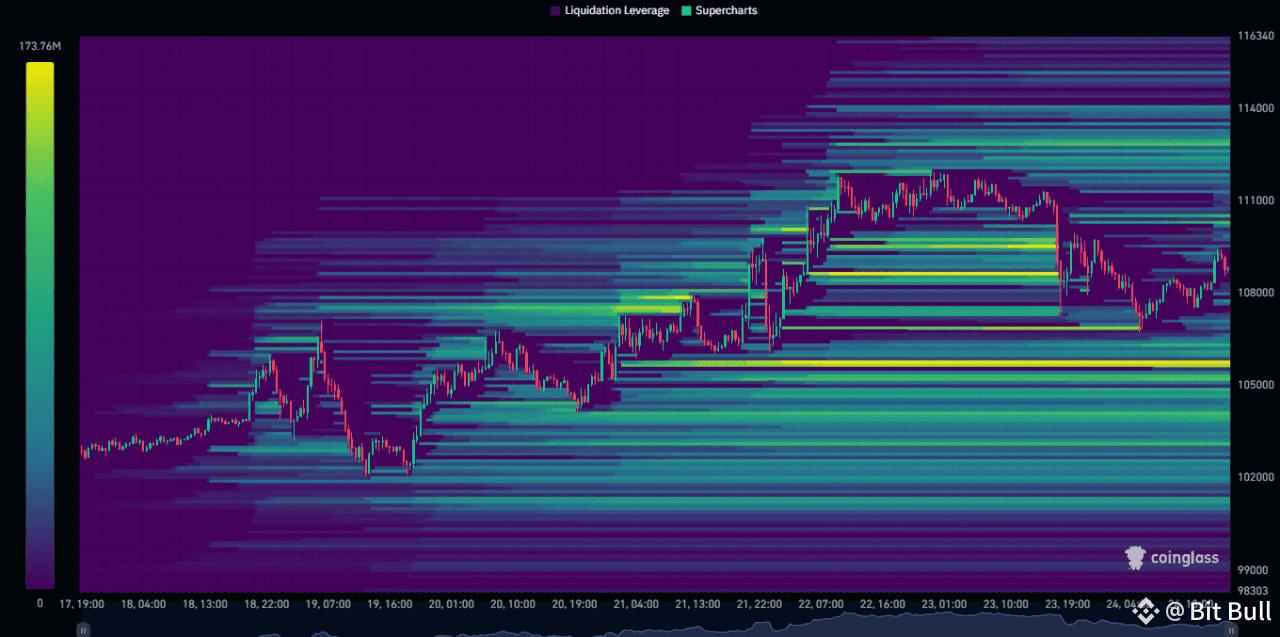
On the weekly timeframe, the BTC liquidity heatmap reveals a significant concentration of liquidity below the current price. This suggests that Bitcoin may move lower to sweep that downside liquidity before making its next major move.
On the 4-hour timeframe, TOTAL is showing a strong bearish divergence, with the RSI dropping from the supply zone. This signals weakening momentum, suggesting that a market correction may be due.

Leverage: 10X
Targets:
1st TP 107,500
2nd TP 104,000
3rd TP 100,000
4th TP 97,000
For daily new signals like this, by following these simple steps:
Click my Binance LIVE for more information and signals update
$BTC