

Ethereum is starting to look very interesting from both a technical and fundamental perspective.
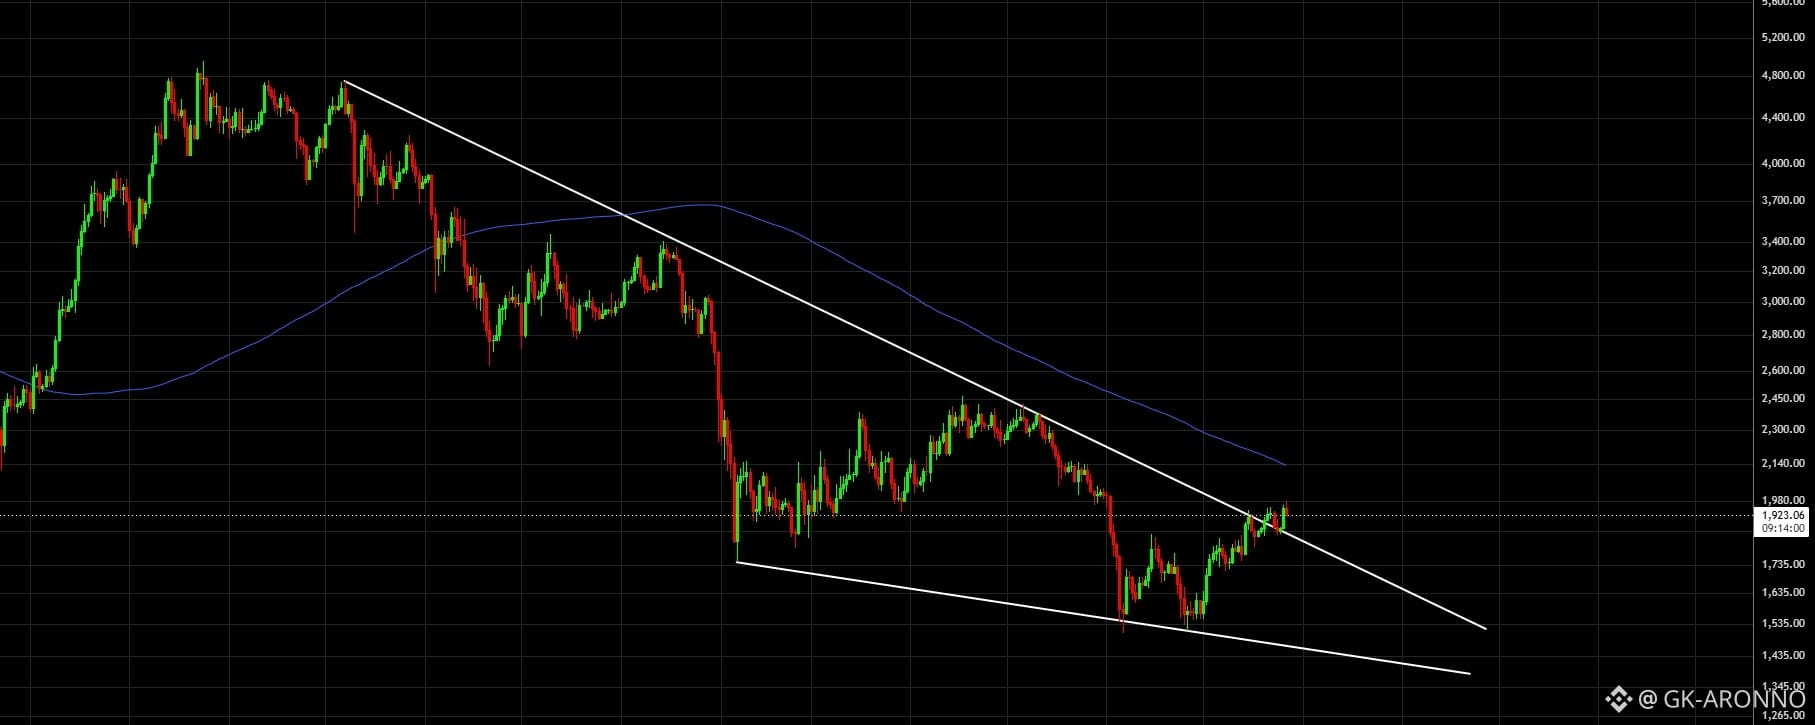
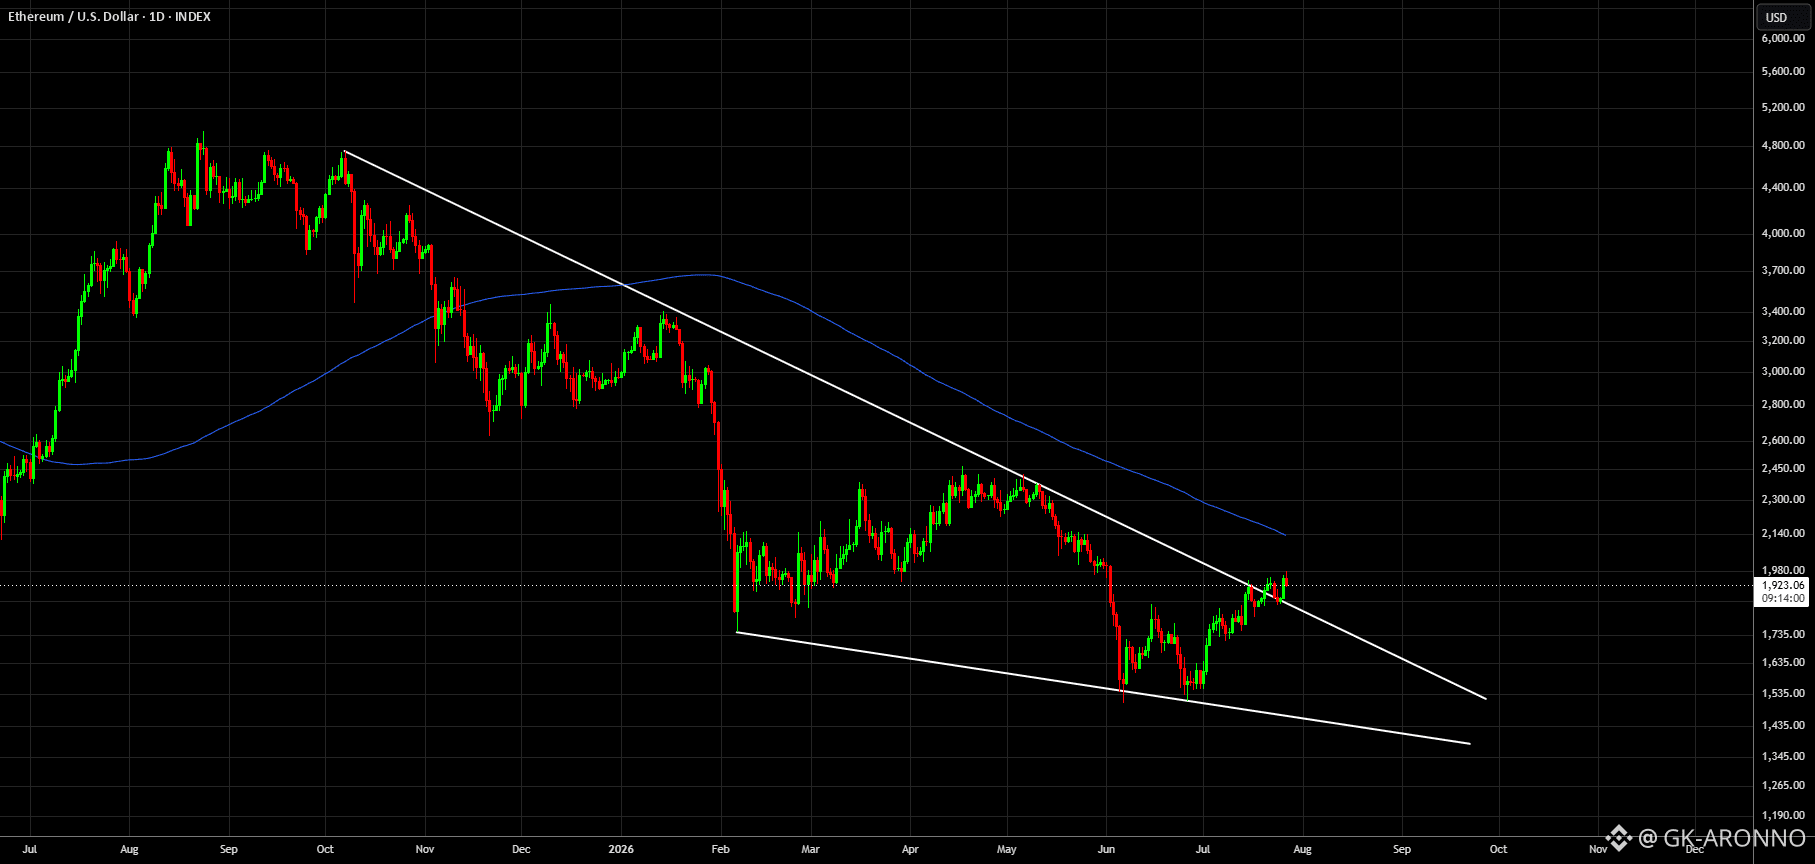
ETH has broken above a descending wedge that had been containing price since October 2025. This breakout comes after a strong month, with Ethereum gaining 33%, while Bitcoin gained only around 12% over the same period.
ETH Is Quietly Outperforming Bitcoin
One of the strongest signals right now is on the ETH/BTC chart.
As shown in the ETH/BTC chart, Ethereum has significantly outperformed Bitcoin over the last month. The price recently broke above a long-term downtrend line that had capped price since August 2025. Even more importantly, two days ago ETH/BTC reclaimed its 200-day moving average for the first time since January 2026.
This tells me that money is beginning to rotate into Ethereum.
The technical strength has also been supported by several bullish catalysts over the past few weeks:
The SEC officially closed its Ethereum 2.0 investigation, removing a major regulatory overhang around staking. At the same time, growing discussion around staking-enabled ETF products and increasing institutional demand for yield-generating crypto assets has strengthened Ethereum's investment case. More investors are beginning to view ETH not only as a speculative asset, but also as a yield-bearing one.
The 200-Day Moving Average Is the Key
Back to the ETH/USDT chart, while the breakout above the wedge is encouraging, I think the real test still lies ahead.
The breakout opens a clear path toward the 200-day moving average (blue line). Ethereum has now traded below this moving average for 256 consecutive days without testing it.
History Shows that First Test On 200DMA is Not Successful
One reason I'm paying so much attention to the 200-day moving average is because history tells an interesting story:
2018 Bear Market
After breaking below the 200-day moving average, Ethereum stayed underneath it for about 40 days before attempting to reclaim it.
The breakout initially looked promising, but buyers couldn't maintain control. Price quickly lost the moving average and continued its bearish trend.
2022 Bear Market
The same pattern appeared in 2022 bear market.
Ethereum remained below the 200-day moving average for approximately 85 days before finally testing it. Once again, the first reclaim attempt failed, and price rolled over before eventually finding its final bottom months later.
Why This Cycle Looks Different ?
This time, the setup is noticeably different.
Instead of reaching the 200-day moving average after only a month or two, Ethereum has spent 256 days below it without even getting close.
That's why I believe this upcoming test is one of the most important technical events for Ethereum in this cycle.
If buyers can reclaim the 200-day moving average and successfully hold above it, there is a strong case that the bear market bottom is already behind us.
If the reclaim fails, history suggests Ethereum could still have another leg lower before a true long-term bottom is established.
Did Ethereum Already Bottom?
Personally, I think the odds are improving.
The low at $1,505 on June 6 has a reasonable chance of being this cycle's bottom.
The improving relative strength versus Bitcoin, the wedge breakout, and the improving fundamental backdrop all support that thesis.
There's also an interesting historical parallel: crypto markets as everybody already knows, moving in a roughly four-year cycle. During the previous bear market, Ethereum also bottomed in June, nearly four months before Bitcoin, which didn't make its final low until November 2022.
Whether history repeats itself remains to be seen.
