
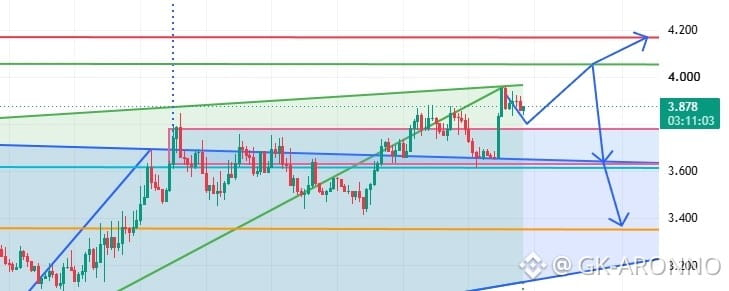

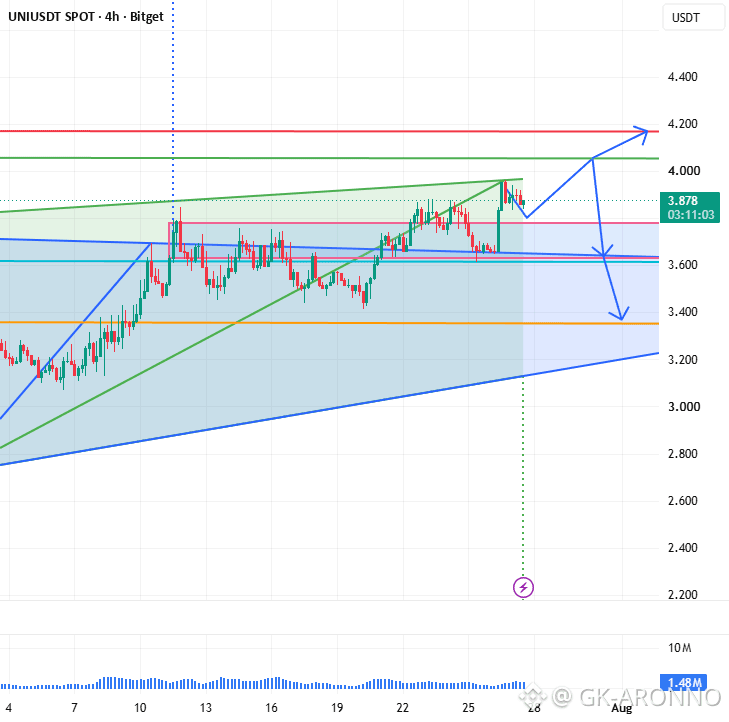
The 4H chart of UNI isn't just showing price movement; it's showing a battle between buyers who have controlled the trend for weeks and sellers who are trying to defend a major resistance area.
However, the recent breakout above the previous swing highs wasn't just another small bounce; it was accompanied by stronger momentum and sustained buying.
• The Bigger Picture: Looking at the left side of the chart, UNI experienced a prolonged downtrend that formed a descending triangle-like structure before eventually bottoming around the $2.30–2.40 region.
From that bottom, buyers stepped in aggressively. The market didn't simply bounce; it completely changed character.
• Rising Wedge Formation: The current move is developing inside a Rising Wedge, which is generally considered a bearish pattern when it forms after an extended rally.
• Horizontal Resistance Cluster: Price is currently testing several resistance levels simultaneously.
• Immediate Resistance: $3.88 – $3.95
This area has already rejected price multiple times. Every rejection tells us sellers are still defending this zone.
• Major Resistance: around $4.15–4.18
This is the red resistance line you've marked. If bulls can finally break above this level, the entire market structure changes. Above here, there isn't much historical resistance until significantly higher prices.
Beyond the chart, the fundamentals are becoming increasingly difficult to ignore. Instead of protocol growth existing separately from token value, these upgrades strengthen the relationship between increasing platform activity, protocol revenue, and the existing UNI burn mechanism.
• Volume Analysis: One thing stands out immediately. The biggest volume spike occurred during the explosive rally from the lows.
Since then:
• volume has gradually declined,
• rallies have become slower,
• candles are overlapping more frequently.
This often suggests momentum is cooling. It doesn't necessarily mean a crash is coming. Instead, it tells us that the market is waiting for fresh participation before choosing its next direction.
• Bullish Scenario: If buyers manage to reclaim momentum and break above the wedge resistance with convincing volume, several bullish confirmations would occur simultaneously.
The first upside objective becomes: $4.15–4.20
Breaking that zone could open the path toward the next psychological resistance. Momentum traders would likely begin entering aggressively after confirmation.
• Bearish Scenario: The chart also presents a realistic bearish possibility. Rising wedges frequently resolve downward.
If the price loses $3.65, it would increase the probability of a corrective move toward $3.33 or even the ascending trendline around $3.20 before buyers attempt another advance.
Therefore, I am currently observing UNI on Bitget. The easy tracking of price action, volume, and overall market sentiment in one place, Bitget, is giving us the upper hand and allows for executing trades with high liquidity.
Now I am waiting to do some quick scalp
🔴 SHORT:
• Entry: $3.90–$3.95 on any bounce toward VWAP (rejection candle)
• SL: $4
• TP1: $3.83 - TP2: $3.75 - TP3: $3.60
🟢 LONG:
• Entry: $3.72–$3.76 AFTER confirmed sweep + reversal candle
• SL: $3.65 (below flush zone)
• TP1: $3.84 - TP2: $3.95 - TP3: $4.05
This is not financial advice; it's my personal technical view based on the current chart. So always manage risk and wait for confirmation before entering any trade.
