🚨 🚨
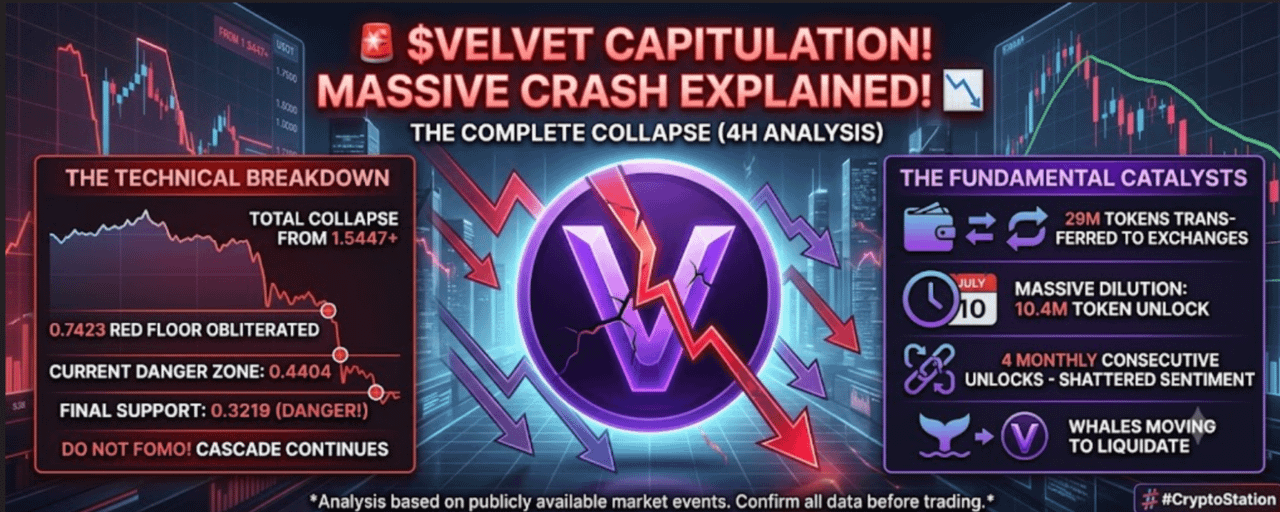
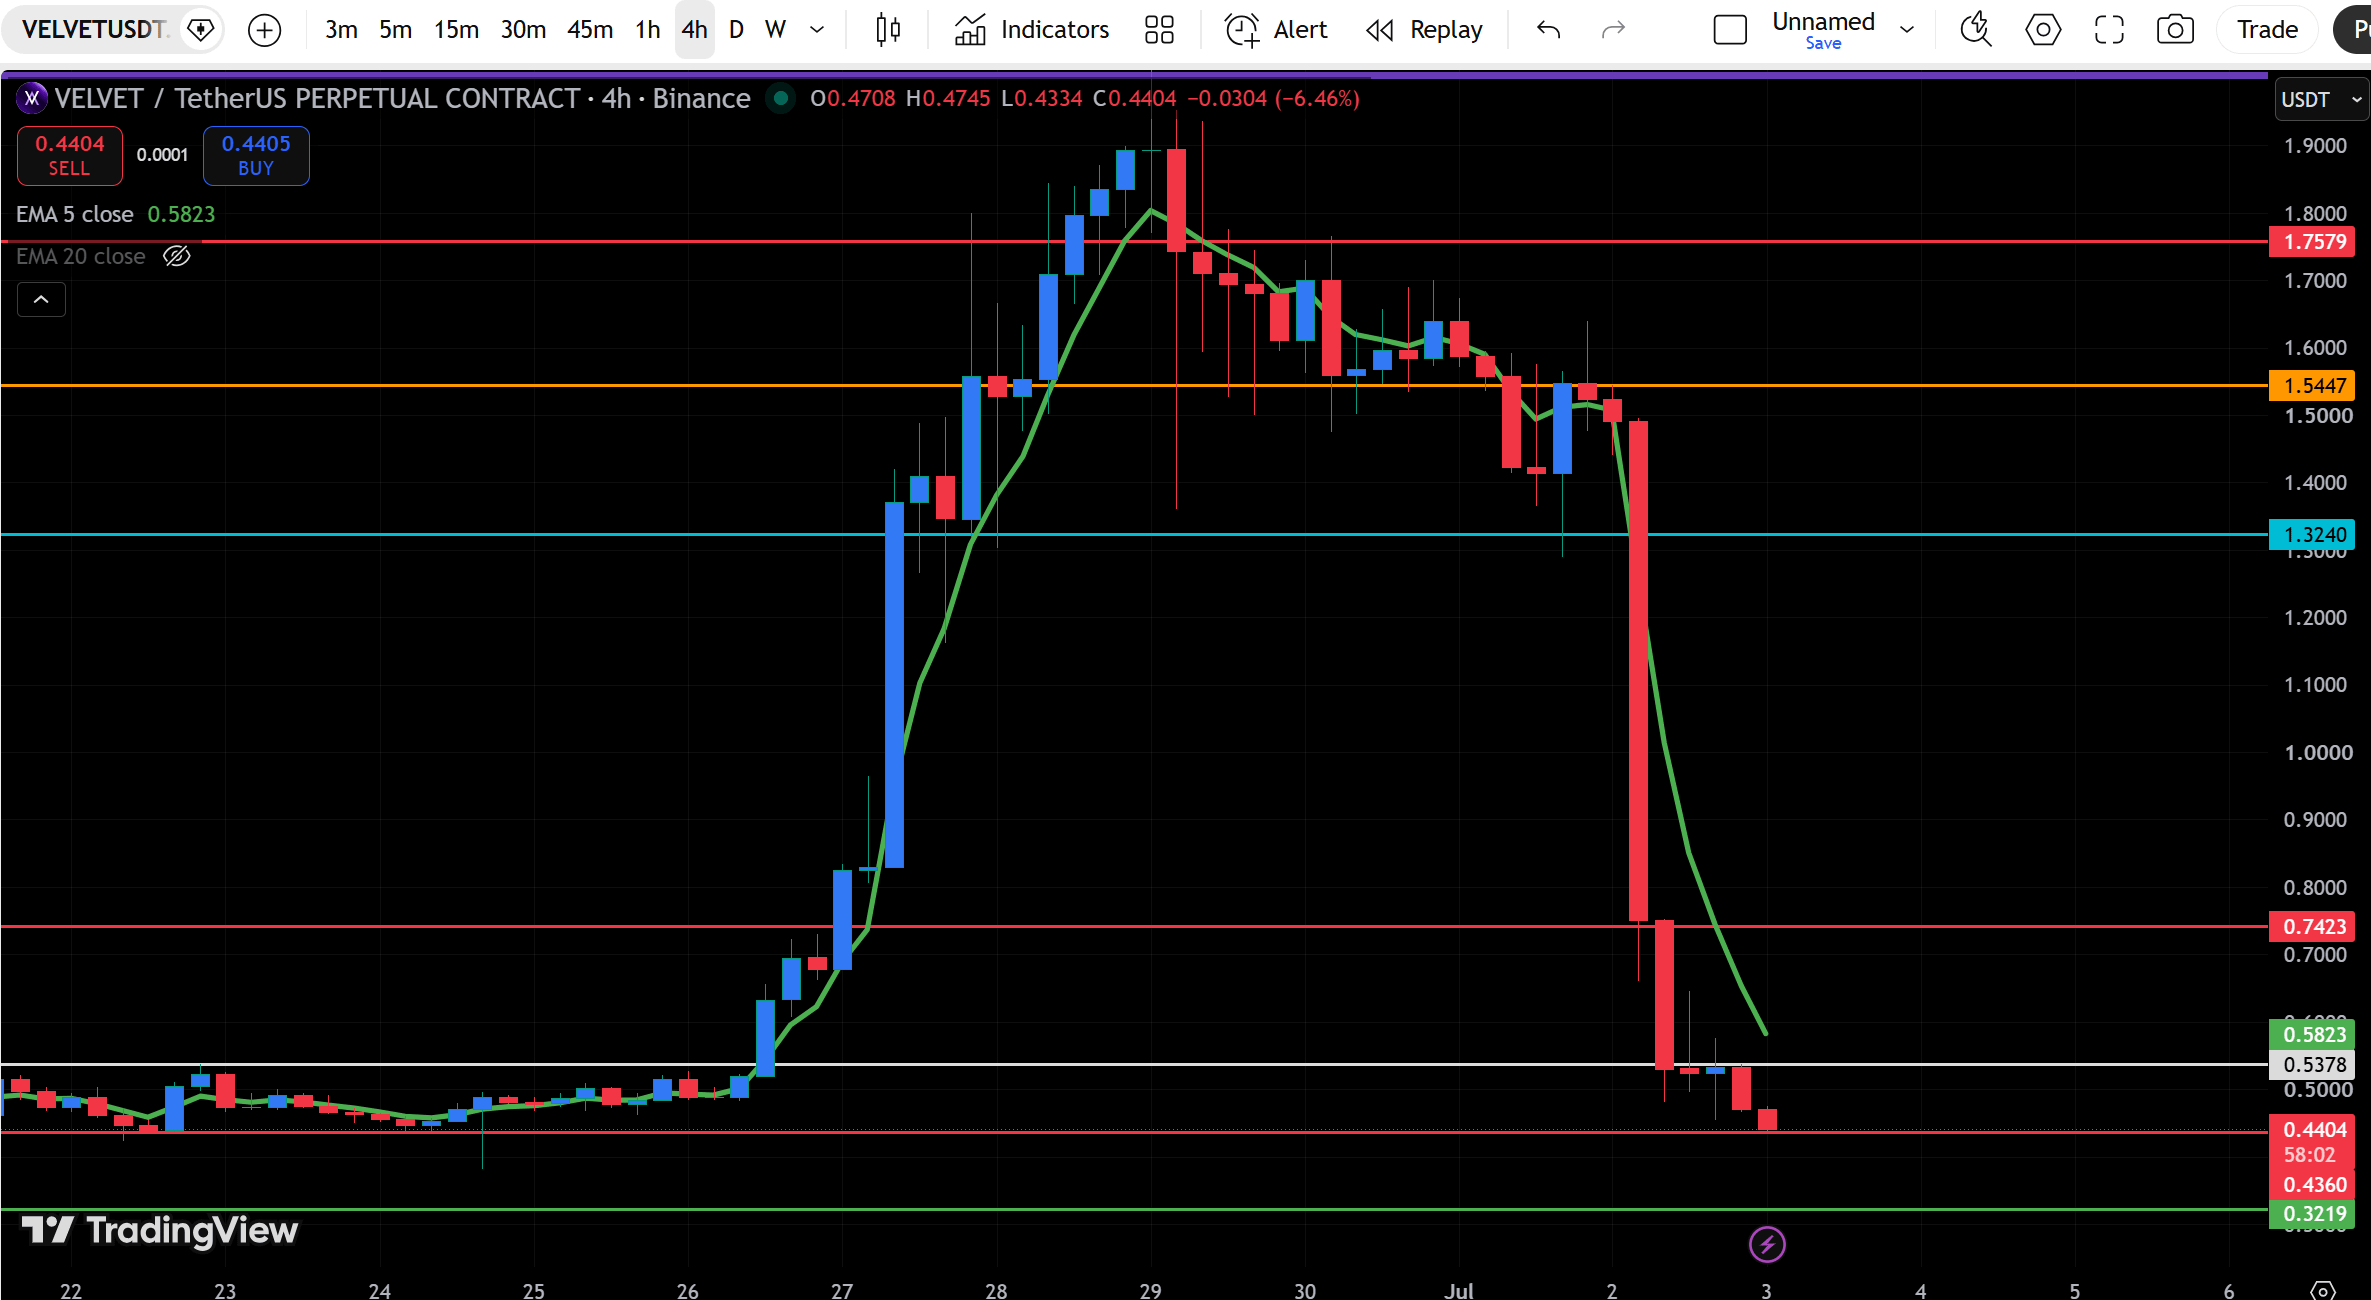
The 4-hour chart for VELVETUSDT.P is printing a devastating red candle, wiping out weeks of gains in a matter of hours. The price has plummeted from the upper range straight down to the macro floor! 📉

🔍 The Technical Breakdown
The Cascade: After failing to hold the 1.5447 yellow zone and the 1.3240 cyan line, VELVET suffered a total structural collapse.
Floors Obliterated: The sell-off was so aggressive it completely ignored the 0.7423 red support line and the 0.5378 white line.
Current State: The price is now trading down at 0.4404, struggling to find any buy-side liquidity to stop the bleeding.
🛠️ The Fundamental Catalysts
This isn't just a technical correction; there are major on-chain and fundamental drivers behind this sudden collapse:
Project-linked wallets and market makers transferred nearly 29 million tokens to exchanges during the prior rally, creating heavy overhead supply.
The market is actively front-running a massive dilution event, as a 10.4 million token unlock is scheduled to hit the market on July 10.
This upcoming unlock is only the first of four consecutive monthly token unlocks, severely dampening long-term investor sentiment.
🎯 Key Levels & Strategy
The Last Line of Defense: The asset is currently sitting on the immediate 0.4404 support. If this breaks, the final macro floor visible on this structure is the green line all the way down at 0.3219.
The Strategy: Do not try to catch a falling knife. With heavy unlocks approaching and whales moving tokens to exchanges, longing this setup carries extreme risk. Wait for a clear baseline to form and hold before looking for any relief bounces.
#Velvet #VELVETUSDT #TechnicalAnalysi #EthereumBreaks$1700Up7.98%
#PhiladelphiaSemiconductorIndexFalls4%